General Dynamics (GD) Fundamental and Technical Stock Analysis: Can the Defence Prime Keep Outperforming?
$364.70
04 Mar 2026, 12:54
Neutral

Join Minipip Academy and access free courses in investing, trading, economics, and more.
Sign Up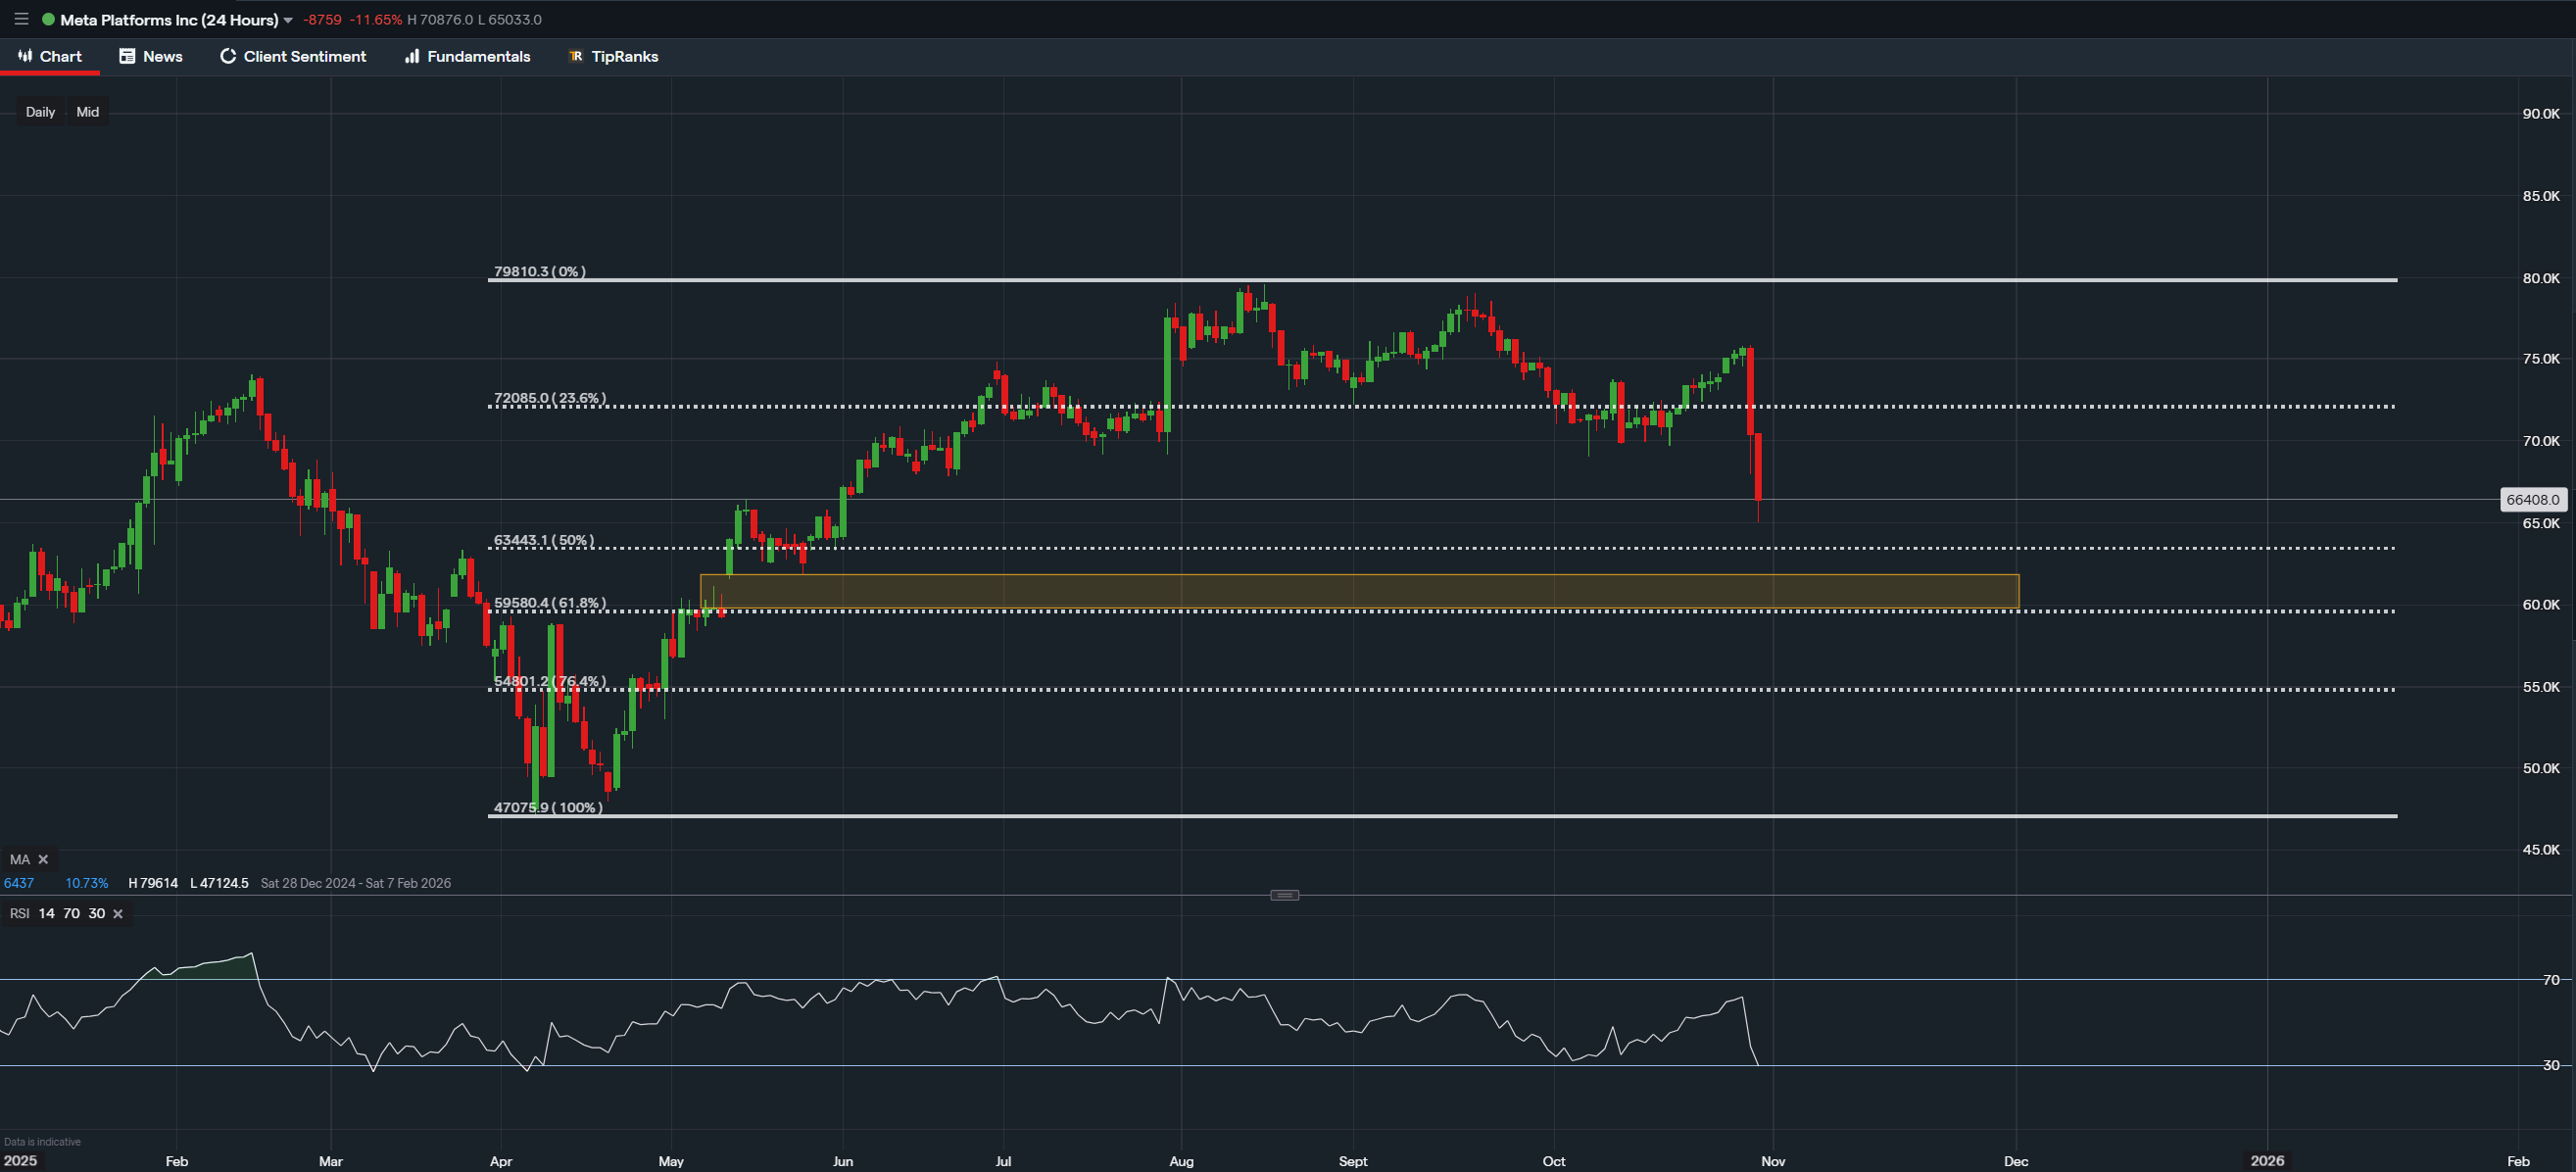
Meta Platform Inc Daily chart
Technical Overview
Meta Platforms (META) has recently seen a sharp pullback following its latest earnings report, which included a one-time $15.93 billion tax charge tied to President Trump’s “One Big Beautiful Bill.” While this caused a short-term shock to investor sentiment, revenue growth of 26% to $51.24 billion continues to highlight the company’s strong operational base and expanding AI-driven business model.
Technical Snapshot: Price Pulls Back to the 50% Fibonacci Retracement
On the chart, Meta’s share price is currently retracing back toward the 50% Fibonacci level, following its earlier rejection from the higher Fibonacci zones. Between the 61.8% and 50% retracement levels, a clear fair value gap (FVG) is visible — an area where price historically moved too quickly, leaving an imbalance in the market.
The current downward move appears to be filling this fair value gap, suggesting that the market is addressing this previous inefficiency. Once this gap is filled, the price could potentially stabilise and set up for a reversal or swing back to the upside, provided that momentum begins to shift in favour of buyers.
This zone often serves as a technical confluence area, where retracement structure, prior price inefficiencies, and trader interest overlap conditions that frequently precede a change in market direction.
Momentum Indicators: RSI Shows Oversold Conditions
The Relative Strength Index (RSI) is now sitting around the 30 level, marking oversold conditions. This reading suggests that selling pressure may be reaching exhaustion, and while not an immediate buy signal, it may indicate that the market is approaching a potential turning point.
Traders and investors could begin planning for possible re-entry opportunities once confirmation signals — such as bullish candles or a momentum shift — start to appear near this 50% Fibonacci retracement area.
Outlook: Watching for a Potential Recovery Setup
If price manages to hold above or near the 50% retracement level after completing the fair value gap fill, it could pave the way for a potential recovery swing back toward the 38.2% or even 23.6% retracement zones, where overhead resistance may come into play.
Conversely, if weakness persists and price slips back below the 61.8% level, it could suggest that further downside remains possible before a stable base forms.
In summary, Meta is currently trading within a key technical zone, where a Fibonacci retracement, fair value gap fill, and oversold RSI all converge. These combined factors may create the foundation for a potential short-term reversal or accumulation phase — giving both traders and investors areas of interest to watch closely in the days ahead.
Disclaimer: For educational purposes only. Not financial advice. Always do your own research before investing.

Tradable assets:
Min.Deposit:
Max Leverage:
FCA:

Rating:


 Earnings Calendar
  Economic Calendar
  VAT Calculator
  Tax Free Childcare Calculator
 Percentage Calculator
 Compound Interest Calculator
  Loan Overpayment Calculator
 Mortgage Calculator
 Credit Card Calculator
 Investing
  Economics
 Trading
  Technical Analysis
  Personal Finance
 Calculator


