General Dynamics (GD) Fundamental and Technical Stock Analysis: Can the Defence Prime Keep Outperforming?
$364.70
04 Mar 2026, 12:54
Neutral

Join Minipip Academy and access free courses in investing, trading, economics, and more.
Sign Up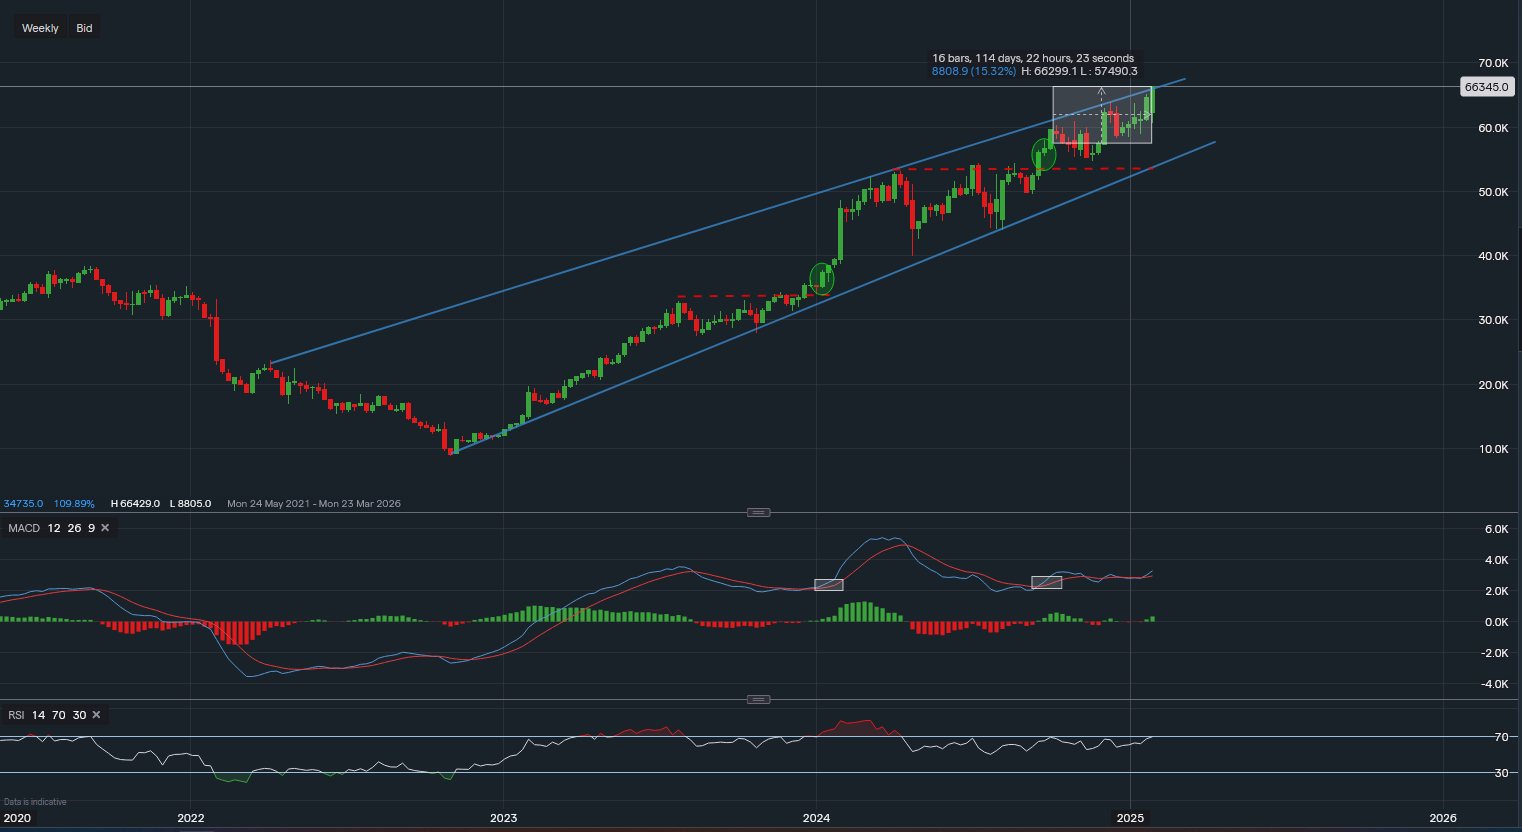
Chart & Data from IG
Meta Platforms (META) has seen a notable rally of over 15% since our last analysis on October 3rd of last year. As of pre-market trading, Meta shares are priced at approximately $663.45, climbing into a critical resistance zone near the upper trendline of the channel visible on the weekly chart. With earnings approaching, this resistance level around $660 will play a pivotal role in determining the stock’s short-term direction.
If Meta’s stock price holds above the $660 resistance level following the earnings report, there is a strong possibility of a breakout, potentially fueling a short-term rally toward $700 per share. Such a move would attract momentum traders and reinforce the bullish outlook for the stock.
On the downside, weak earnings coupled with the current resistance could trigger a decline. The key support level to watch is $600, representing a potential 10% drop—a scenario that has previously occurred with Meta.
Meta’s technical indicators have remained supportive of its recent price action:
While the technical outlook for Meta is encouraging, this earnings season is expected to bring heightened volatility compared to last year. Investors should consider potential risks, especially as high valuations leave little room for disappointment. Earnings results will be the key driver in determining whether Meta breaks above resistance or retreats to support levels.
Meta’s stock is at a critical juncture heading into earnings, with resistance at $660 and support levels at $600 and $550 playing significant roles in shaping its near-term trajectory. A breakout above resistance could drive prices toward $700, while weaker-than-expected earnings might lead to a deeper correction. Despite the risks, technical indicators remain supportive, offering an optimistic backdrop for investors.
Stay prepared for volatility as Meta’s earnings report could be the deciding factor in the stock’s next major move.

Tradable assets:
Min.Deposit:
Max Leverage:
FCA:

Rating:


 Earnings Calendar
  Economic Calendar
  VAT Calculator
  Tax Free Childcare Calculator
 Percentage Calculator
 Compound Interest Calculator
  Loan Overpayment Calculator
 Mortgage Calculator
 Credit Card Calculator
 Investing
  Economics
 Trading
  Technical Analysis
  Personal Finance
 Calculator


