General Dynamics (GD) Fundamental and Technical Stock Analysis: Can the Defence Prime Keep Outperforming?
$364.70
04 Mar 2026, 12:54
Neutral

Join Minipip Academy and access free courses in investing, trading, economics, and more.
Sign Up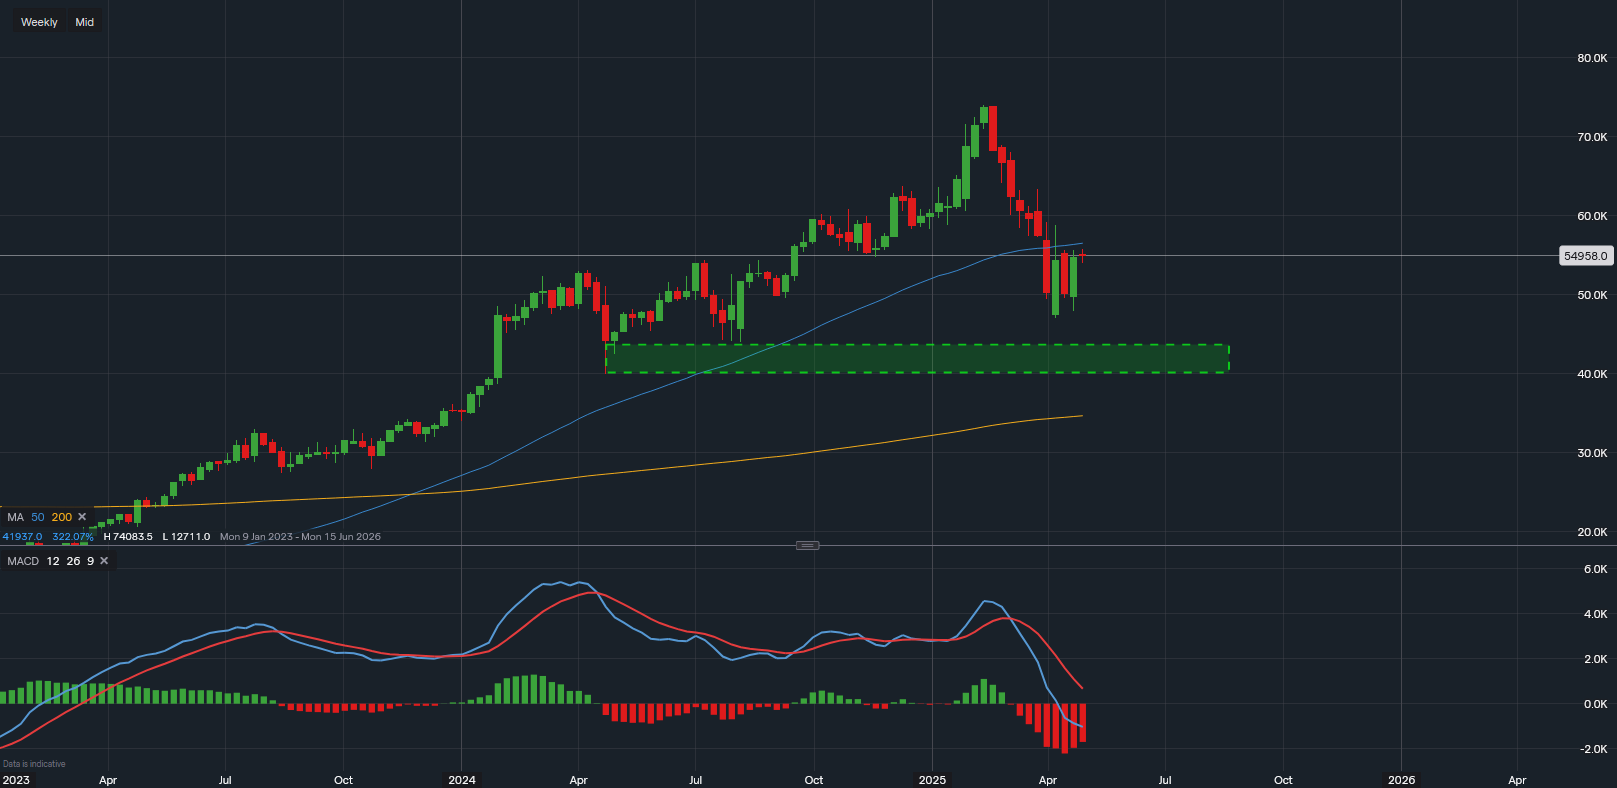
Chart & Data from IG
Meta Platforms Inc. (NASDAQ: META) is showing similar technical patterns to other U.S. mega-cap stocks ahead of this week’s earnings report. With shares currently trading at around $549.58, Meta is sitting below its 50-day moving average (50MA) — a signal that suggests a near-term bearish bias for the stock.
The 50MA is likely to act as immediate resistance in the coming sessions. Although a breakout above this level could generate bullish interest, it may not be enough to signal a sustainable rally. The MACD indicator on the weekly chart remains firmly in bearish territory, highlighting the ongoing downward pressure on Meta’s share price.
Despite short-term technical weakness, Meta has experienced heightened volatility over the past two months. This week’s earnings report may offer a period of stabilisation, depending on the company's forward guidance and strategic updates.
Meta is expected to report a 10% year-over-year (YoY) growth in earnings per share (EPS). However, the stock has already climbed 27% over the same 12-month period, meaning expectations are already high — and any earnings disappointment could trigger a sharp sell-off.
Investors will be especially attentive to:
Q2 guidance and revenue outlook
Commentary on investment plans and capital expenditure
Impact of potential tariffs on innovation and global expansion
Tariffs remain a looming concern for the broader technology sector, which relies heavily on global supply chains and innovation. If new trade restrictions threaten R&D spending or hardware procurement, Meta’s stock could be vulnerable, even if some analysts argue the risk is already priced in.
Immediate Resistance: ~$550 (50-day moving average)
Breakout Level: A move above $600 may provide more confidence to investors, signalling a potential return to bullish momentum
Support Zone: The yearly low of $471.24 marks key support. A breakdown below this level could see the share price fall into the $400–$435 range, which aligns with support zones from the green trend channel on the chart.
Meta remains a top performer on a 12-month basis, but technical indicators and geopolitical uncertainty are weighing on the near-term outlook. The upcoming earnings release will be a major catalyst, and with the stock already up significantly this year, investors should prepare for elevated volatility — especially if earnings or guidance miss expectations.

Tradable assets:
Min.Deposit:
Max Leverage:
FCA:

Rating:


 Earnings Calendar
  Economic Calendar
  VAT Calculator
  Tax Free Childcare Calculator
 Percentage Calculator
 Compound Interest Calculator
  Loan Overpayment Calculator
 Mortgage Calculator
 Credit Card Calculator
 Investing
  Economics
 Trading
  Technical Analysis
  Personal Finance
 Calculator


