AbbVie (ABBV) Stock Analysis: Humira Decline, New Drug Growth, and Technical Consolidation
$228.47
06 Mar 2026, 17:58
Neutral

Join Minipip Academy and access free courses in investing, trading, economics, and more.
Sign Up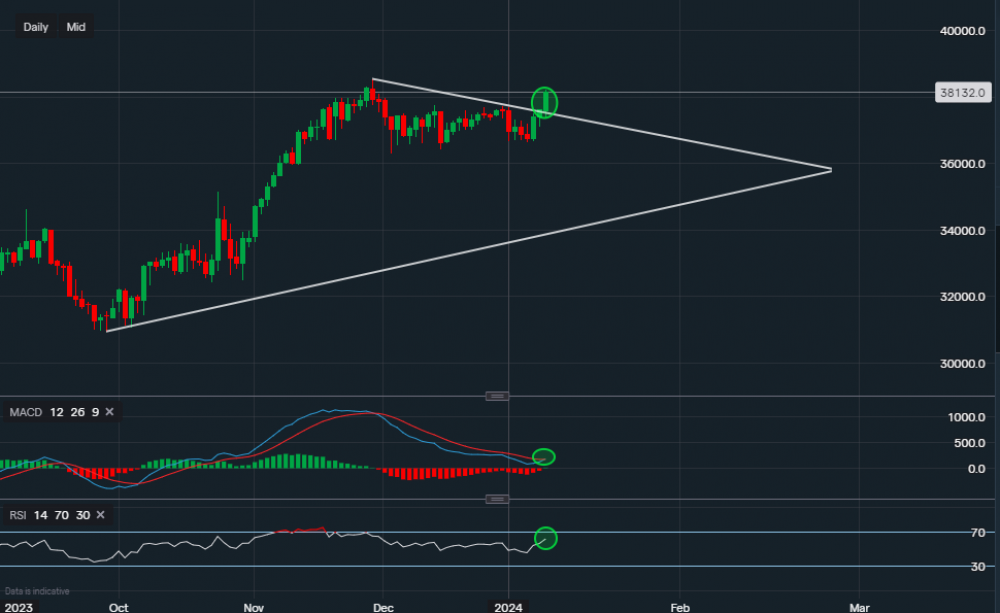
Chart & Data from IG
Looks like Microsoft may have broken out here, an engulfing candlestick is appearing so far on the daily timeframe. The resistance here was along the descending trendline of the triangle reading $375.57, the price closed just above it in yesterday’s session. Today saw a little dip, most likely testing the resistance to support flip, before now pushing higher. The next target for the bulls here is the all-time high reached level of $385.50. The previous resistance of $375.57 is now acting as the initial support here, with a break below potentially seeing Microsoft’s price re-entering the triangle area. Key inflation data over Thursday and Friday will play a big part here, volatility will be raised. Looking at the technical indicators, they are rather positive. The MACD looks like it could turn positive if the session closes around the current level, and the RSI is positively rising as it reads 61 (both highlighted by the green ovals at the bottom of the chart).

Tradable assets:
Min.Deposit:
Max Leverage:
FCA:

Rating:


 Earnings Calendar
  Economic Calendar
  VAT Calculator
  Tax Free Childcare Calculator
 Percentage Calculator
 Compound Interest Calculator
  Loan Overpayment Calculator
 Mortgage Calculator
 Credit Card Calculator
 Investing
  Economics
 Trading
  Technical Analysis
  Personal Finance
 Calculator


