General Dynamics (GD) Fundamental and Technical Stock Analysis: Can the Defence Prime Keep Outperforming?
$364.70
04 Mar 2026, 12:54
Neutral

Join Minipip Academy and access free courses in investing, trading, economics, and more.
Sign Up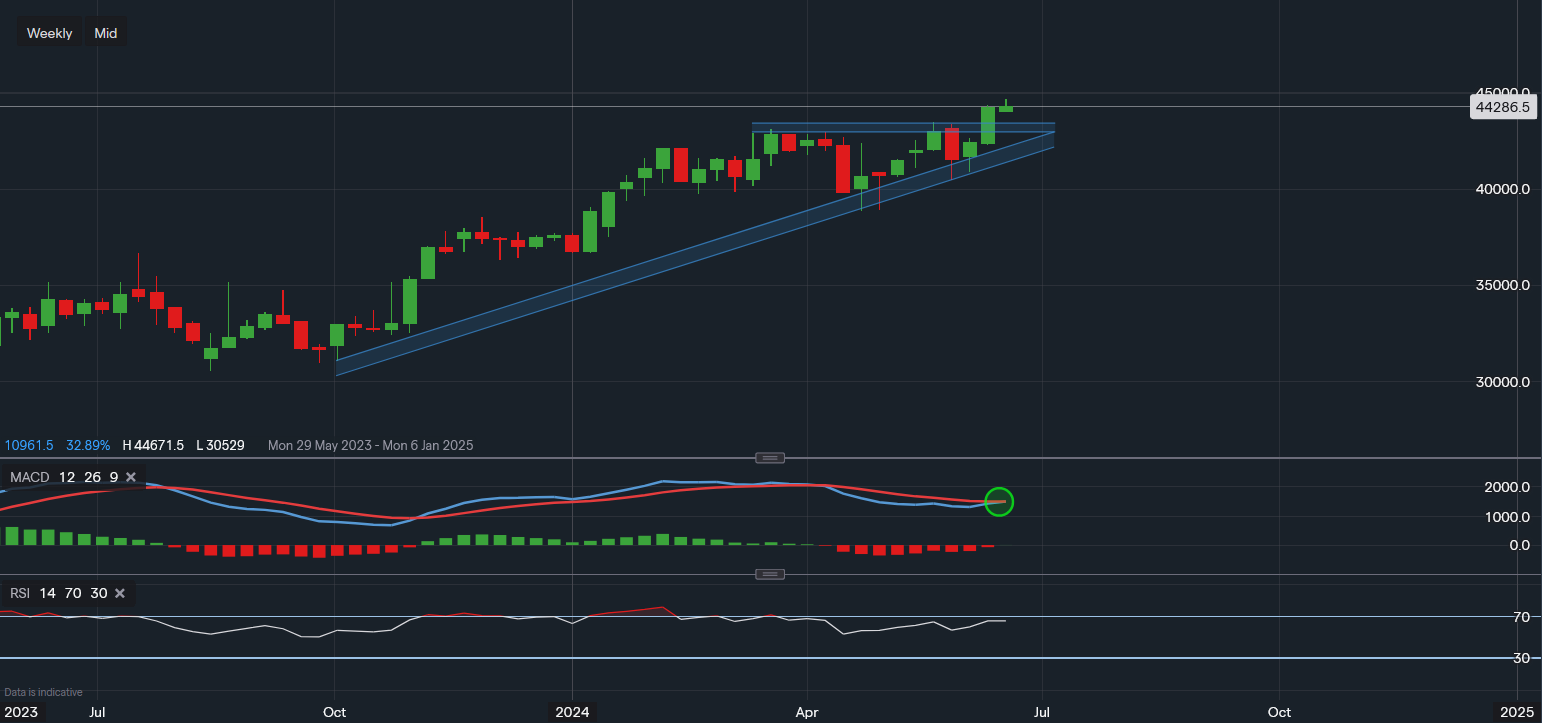
Chart & Data from IG
A potential breakout here for Microsoft on the weekly chart. We can see the share price of the tech giant has moved and closed strongly above the resistance of $434.72 last week. Suggesting bullish momentum for the short term. With the price trading higher, we may see a small pullback for a re-test of this breakout for further confirmation. The previous resistance of $434.72 should now act as support in the short term, although this is not guaranteed and the price could continue higher. As MSFT is trading at all-time highs, there is no resistance above. However, it can be argued that the next psychological resistance is the $450 price level. Towards the downside, a move below the previous breakout resistance of $434.72 may lead to a pullback as low as $420 in order to re-test the April-May consolidation period. Looking at the technical indicators, the MACD seems like it could now turn positive once again and the RSI is already positive as it reads 65.

Tradable assets:
Min.Deposit:
Max Leverage:
FCA:

Rating:


 Earnings Calendar
  Economic Calendar
  VAT Calculator
  Tax Free Childcare Calculator
 Percentage Calculator
 Compound Interest Calculator
  Loan Overpayment Calculator
 Mortgage Calculator
 Credit Card Calculator
 Investing
  Economics
 Trading
  Technical Analysis
  Personal Finance
 Calculator


