NASDAQ Outlook: Is a Bullish Rally Taking Shape?
$256.43
07 Jan 2026, 00:38

Chart & Data from IG

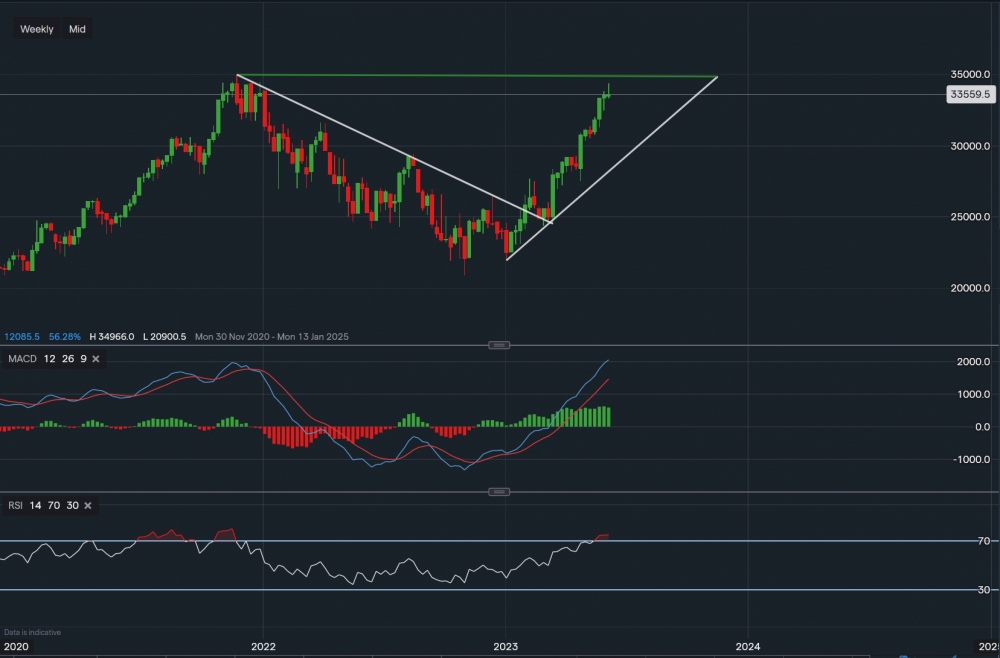
Taking a look at more constituents of the Nasdaq today to highlight the gains and opportunities tech stocks have created so far in the year. In this instance, we’re looking at Microsoft whose shares are currently trading at around $335.59 a share in pre-market trading. Based on the weekly timeframe, we can see that its price is almost at its all-time high, which is $349.66 (green trendline). This can also be classed as the toughest point of resistance that Microsoft will face this year, a break above this level could see its price edge higher setting new all-time highs. Since March, the stock has been in a bullish trend with great support levels below. Support sits at $324.74 then at $317.42 and then at $303.28 (along the ascending trendline). A break below the trendline may indicate a move even lower, to as low as $275-$280 a share. However, at this moment in time, the bias remains bullish. Looking at the technical indicators, MACD is strongly positive and so is the RSI as it reads 74. Although, it’s important to note that the RSI has entered the ‘overbought’ territory. Hence, a short-term retracement could occur.