General Dynamics (GD) Fundamental and Technical Stock Analysis: Can the Defence Prime Keep Outperforming?
$364.70
04 Mar 2026, 12:54
Neutral

Join Minipip Academy and access free courses in investing, trading, economics, and more.
Sign Up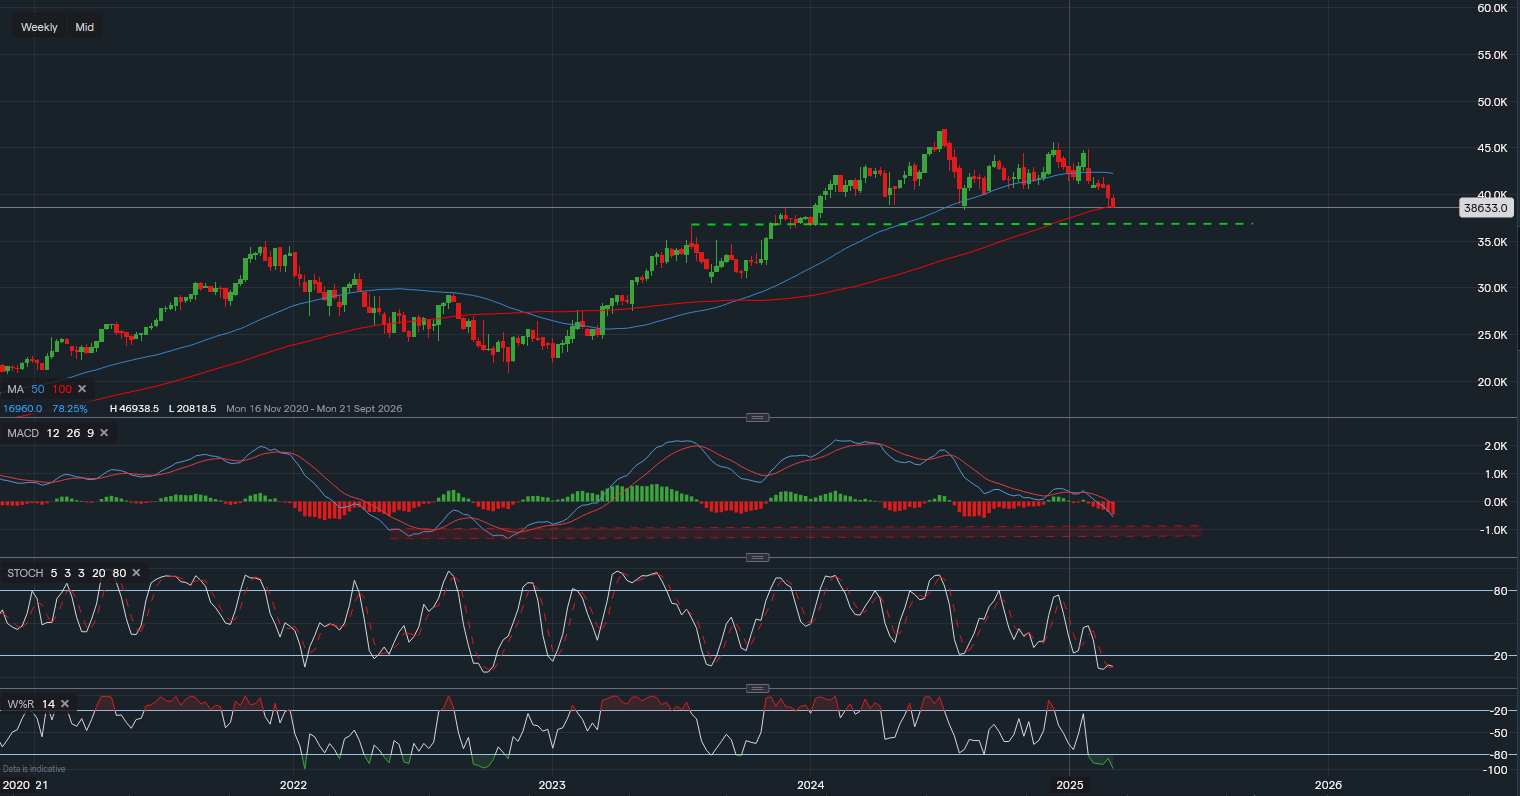
Chart & Data from IG
Microsoft's stock has recently declined by 17% from its all-time high, raising concerns among investors. As of now, Microsoft shares are trading at $386.33, hovering around the 100-day moving average (100MA) of $387.54. This level is a crucial technical indicator that could dictate price movements throughout March.
Investors should closely monitor how Microsoft stock closes this week in relation to the 100MA. A clear break and close below $387.54 could confirm further downside, while any bullish reversal signals from key indicators could indicate a potential rebound.

Tradable assets:
Min.Deposit:
Max Leverage:
FCA:

Rating:


 Earnings Calendar
  Economic Calendar
  VAT Calculator
  Tax Free Childcare Calculator
 Percentage Calculator
 Compound Interest Calculator
  Loan Overpayment Calculator
 Mortgage Calculator
 Credit Card Calculator
 Investing
  Economics
 Trading
  Technical Analysis
  Personal Finance
 Calculator


