General Dynamics (GD) Fundamental and Technical Stock Analysis: Can the Defence Prime Keep Outperforming?
$364.70
04 Mar 2026, 12:54
Neutral

Join Minipip Academy and access free courses in investing, trading, economics, and more.
Sign Up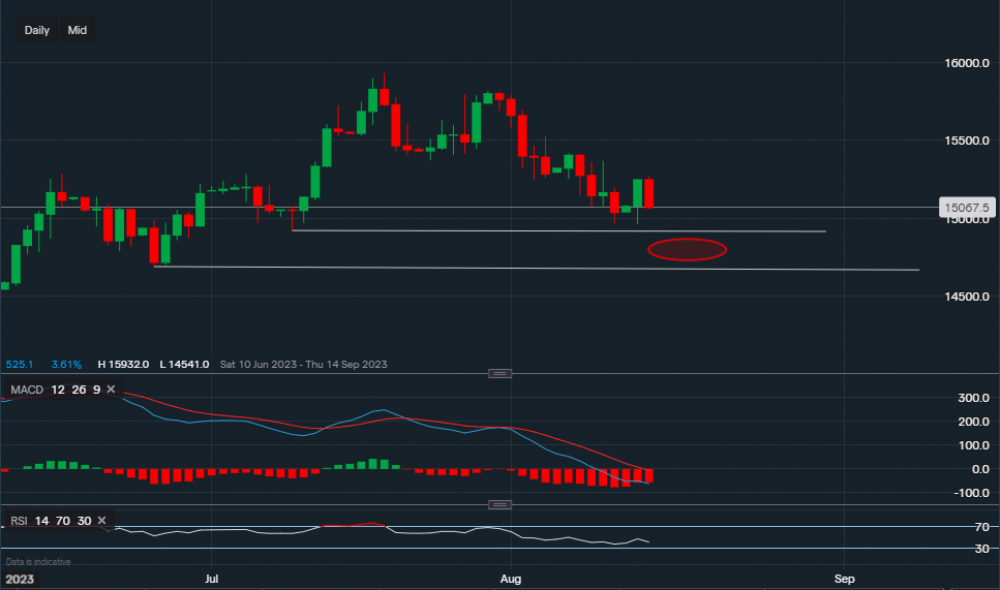
Chart & Data from IG
Taking a look at Nasdaq after the recent retail sales data. The data came in stronger than expected, suggesting that wage growth in the US continues and is robust. This also means that Americans are spending more which raises the question for the Fed regarding inflation and its target to bring it down to 2%. The US markets spiked on the news but now have turned the other way. Currently, the index is trading around 15,067. Looking at the daily interval, we can see support at 14,920 (upper trendline) and then at 14,866. This area highlighted by the oval is a key support zone, as a break below 14,866 could see the index fall as low as 14,233. Although, this would have to be analysed at the time. For the time being, the bias remains bearish unless we see consolidation along the upper trendline support on the chart. Looking at the technical indicators, MACD is strongly negative and the RSI keeps faltering as it now reads 41. FOMC minutes are due tomorrow at 19:00 GMT, until then volatility shouldn’t be drastic.

Tradable assets:
Min.Deposit:
Max Leverage:
FCA:

Rating:


 Earnings Calendar
  Economic Calendar
  VAT Calculator
  Tax Free Childcare Calculator
 Percentage Calculator
 Compound Interest Calculator
  Loan Overpayment Calculator
 Mortgage Calculator
 Credit Card Calculator
 Investing
  Economics
 Trading
  Technical Analysis
  Personal Finance
 Calculator


