General Dynamics (GD) Fundamental and Technical Stock Analysis: Can the Defence Prime Keep Outperforming?
$364.70
04 Mar 2026, 12:54
Neutral

Join Minipip Academy and access free courses in investing, trading, economics, and more.
Sign Up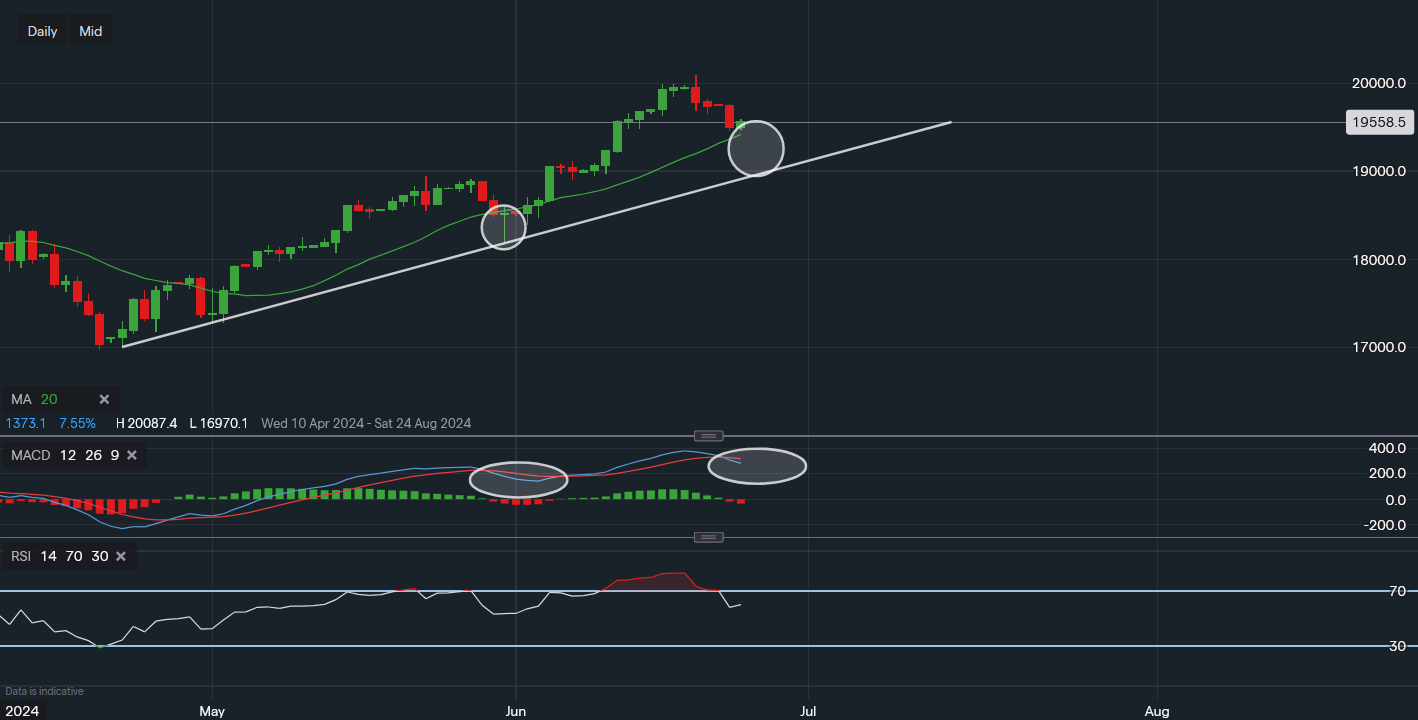
Chart & Data from IG
Taking a look at the Nasdaq as it tries to recoup some of the recent losses. Currently, the index is trading at around 19,558 at the NY open. Looking at its latest price action, based on the daily chart, we can see the last time it shed around 3-4% it tested the 20-day moving average. In fact, it ended up slipping below it. However, after finding its footing along the supportive trendline around 18,187, the index managed to close around the 20MA. This created a hammer candlestick, which tends to be a bullish indication. Following this, the Nasdaq went on to rally higher. So far, the index has pulled back around 2.5%, with a low of 3% recorded yesterday. It has recorded a low of 19,459, which will act as support in the near term. The 20MA is currently reading 19,416, which will act as the more important support if 19,459 were to be broken. If a break below the 20MA was to occur, bulls would then look to support once again along the trendline, or respectively, 19,120 (approximately). In regards to the technical indicators, we can see the MACD has turned negative once more, which points to potentially further moves lower in the short-term, But as we can see it has done so in the past before turning back to positive. During the May pullback, the RSI never moved below the reading of 53. Right now, it is reading 60, so it’s still positive suggesting that some bullish momentum remains.

Tradable assets:
Min.Deposit:
Max Leverage:
FCA:

Rating:


 Earnings Calendar
  Economic Calendar
  VAT Calculator
  Tax Free Childcare Calculator
 Percentage Calculator
 Compound Interest Calculator
  Loan Overpayment Calculator
 Mortgage Calculator
 Credit Card Calculator
 Investing
  Economics
 Trading
  Technical Analysis
  Personal Finance
 Calculator


