General Dynamics (GD) Fundamental and Technical Stock Analysis: Can the Defence Prime Keep Outperforming?
$364.70
04 Mar 2026, 12:54
Neutral

Join Minipip Academy and access free courses in investing, trading, economics, and more.
Sign Up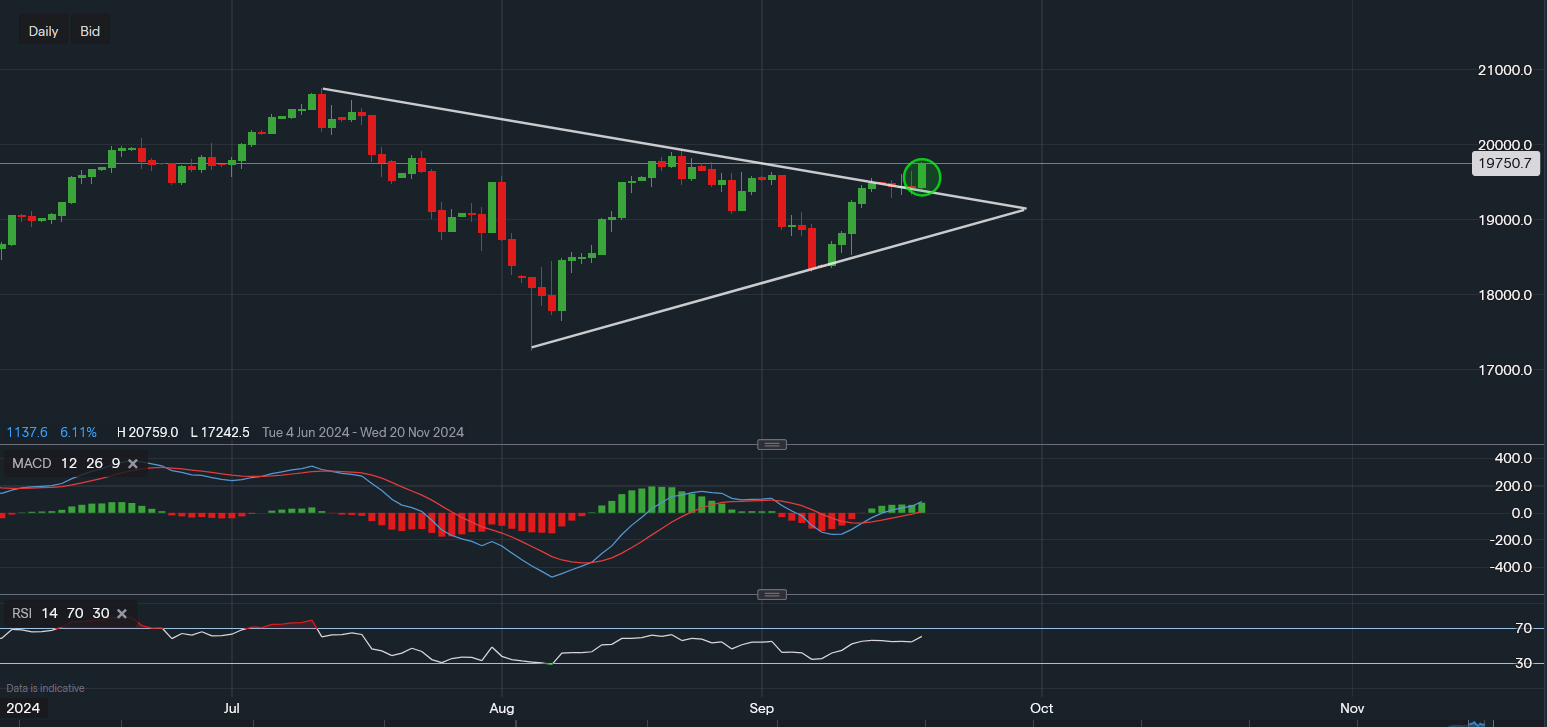
Chart & Data from IG
Possible breakout attempt on the daily chart of the Nasdaq 100 index following a 50bps interest rate cut from the Federal Reserve yesterday. Currently, the tech heavy index is trading at around 19,750 in the pre-market session. We can see the next point of resistance is around 19,938, hence, caution should remain because if this resistance proves challenging, we may see a false breakout. However, a break above it could create the potential for a grind towards the all-time high of 20,759. On the other hand, if a false breakout is to occur due to uncertainty over the upcoming US elections, we may see some downside pressure until after the elections. The near-term support here now is this week’s low of 19,287. A fall below here could shift the focus towards the support level of 18,724 and then the September low of 18,306. Only a move below 18,306 would suggest the possibility of further weakness. Looking at the technical indicators, they have turned bullish once again, however, it is also important to view bigger timeframes as they can have more influence. Zooming out onto the weekly chart, the MACD is still bearish, which could weigh on the index for the near term.

Tradable assets:
Min.Deposit:
Max Leverage:
FCA:

Rating:


 Earnings Calendar
  Economic Calendar
  VAT Calculator
  Tax Free Childcare Calculator
 Percentage Calculator
 Compound Interest Calculator
  Loan Overpayment Calculator
 Mortgage Calculator
 Credit Card Calculator
 Investing
  Economics
 Trading
  Technical Analysis
  Personal Finance
 Calculator


