General Dynamics (GD) Fundamental and Technical Stock Analysis: Can the Defence Prime Keep Outperforming?
$364.70
04 Mar 2026, 12:54
Neutral

Join Minipip Academy and access free courses in investing, trading, economics, and more.
Sign Up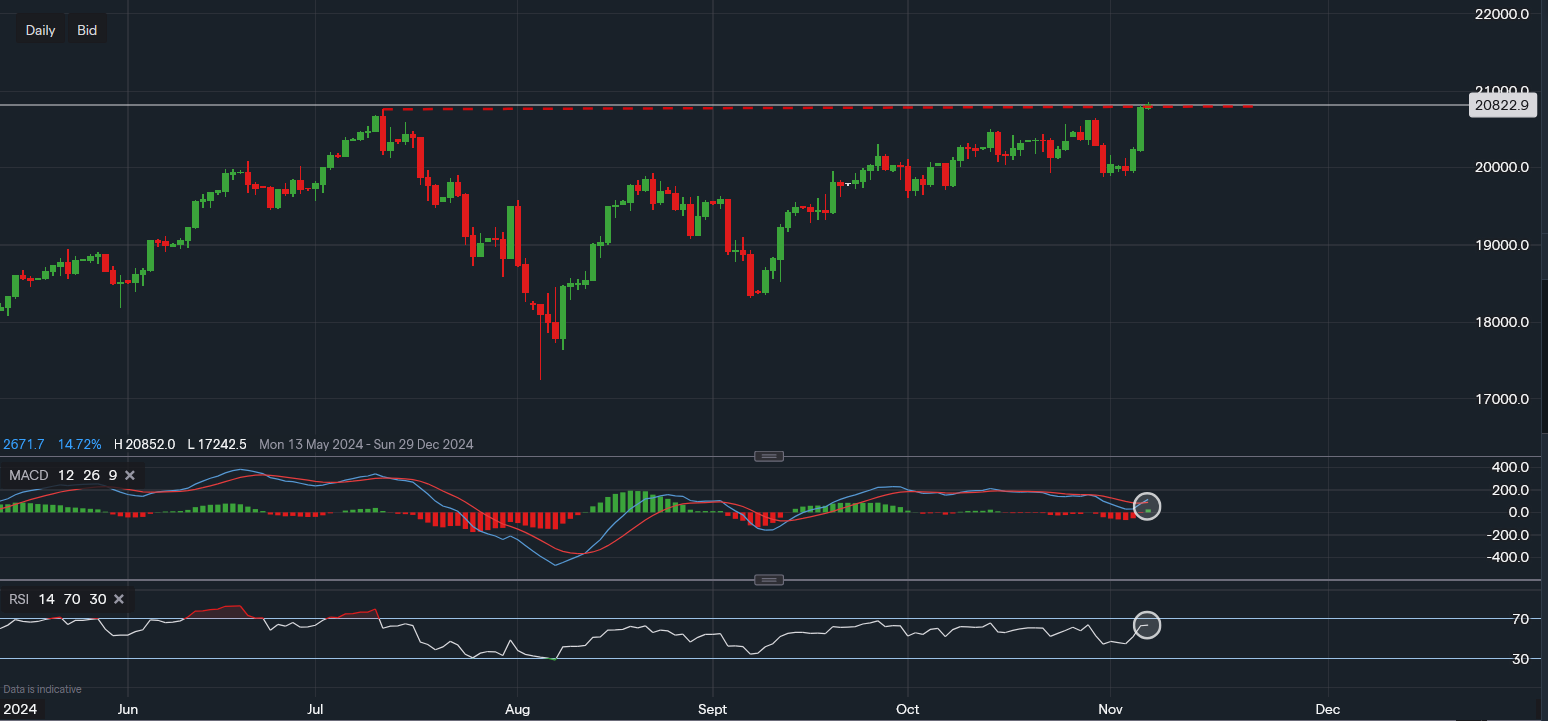
Chart & Data from IG
The Nasdaq 100 index is currently trading around 20,822, following a strong 2.7% gain fueled by post-election optimism in the U.S. The tech-heavy index is now challenging a significant resistance level at 20,759, which marks its previous all-time high. A decisive close above this resistance could pave the way for further gains, positioning the Nasdaq for a possible rally towards the 21,500-22,000 range in the near term.
Traders are closely watching this critical resistance/support zone at 20,759; once breached, this level could flip to a support role, underpinning any continued upward movement. Additionally, recent Federal Reserve rate cuts and anticipated strong earnings results from Nvidia in the coming weeks could fuel more gains, solidifying the Nasdaq’s upward momentum.
If the Nasdaq fails to break through the 20,759 resistance, a re-test of lower support zones could occur, possibly leading to selling pressure. In this scenario, the index might revisit the support zone at 20,315, with a further drop potentially exposing levels between 19,610-19,875. However, this bearish outlook is less likely given current market support from solid earnings reports, a stable U.S. labor market, and potential gains associated with a “Trump Sweep” and the Fed’s accommodative stance.
Momentum Indicators Support a Bullish Outlook
On the technical side, momentum indicators are aligned with a bullish bias. The MACD (Moving Average Convergence Divergence) is turning positive, while the RSI (Relative Strength Index) is at 63, signaling further room for upward movement without yet reaching overbought conditions, much like the S&P 500’s recent momentum.
With the potential for robust earnings, economic stability, and strong technical indicators, the Nasdaq 100 is well-positioned for continued growth, as long as it can maintain support at key levels.

Tradable assets:
Min.Deposit:
Max Leverage:
FCA:

Rating:


 Earnings Calendar
  Economic Calendar
  VAT Calculator
  Tax Free Childcare Calculator
 Percentage Calculator
 Compound Interest Calculator
  Loan Overpayment Calculator
 Mortgage Calculator
 Credit Card Calculator
 Investing
  Economics
 Trading
  Technical Analysis
  Personal Finance
 Calculator


