General Dynamics (GD) Fundamental and Technical Stock Analysis: Can the Defence Prime Keep Outperforming?
$364.70
04 Mar 2026, 12:54
Neutral

Join Minipip Academy and access free courses in investing, trading, economics, and more.
Sign Up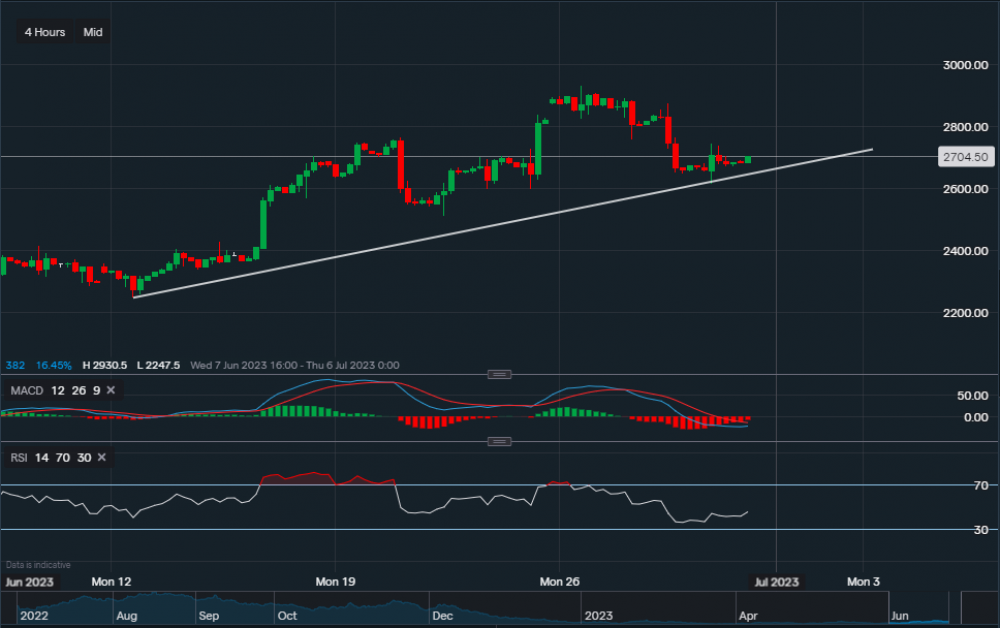
Chart & Data from IG
Taking a look at natural gas as a potential set up towards the upside may be forming. Currently trading at around €27.04, with support below along the trendline. Support sits along the trendline roughly at €26.47 and then at €26.15. A break below €26.16 could see the price fall further towards €25.11. Towards the upside, resistance sits at €27.44. A break and close above this resistance level may see the price of gas rise higher with the resistance then at €27.63. A move above €27.63 could open the door to €28. Looking at the technical indicators, MACD is negative but the volume is lowering (potentially turning neutral) and the RSI has just turned neutral as it reads 45.

Tradable assets:
Min.Deposit:
Max Leverage:
FCA:

Rating:


 Earnings Calendar
  Economic Calendar
  VAT Calculator
  Tax Free Childcare Calculator
 Percentage Calculator
 Compound Interest Calculator
  Loan Overpayment Calculator
 Mortgage Calculator
 Credit Card Calculator
 Investing
  Economics
 Trading
  Technical Analysis
  Personal Finance
 Calculator


