General Dynamics (GD) Fundamental and Technical Stock Analysis: Can the Defence Prime Keep Outperforming?
$364.70
04 Mar 2026, 12:54
Neutral

Join Minipip Academy and access free courses in investing, trading, economics, and more.
Sign Up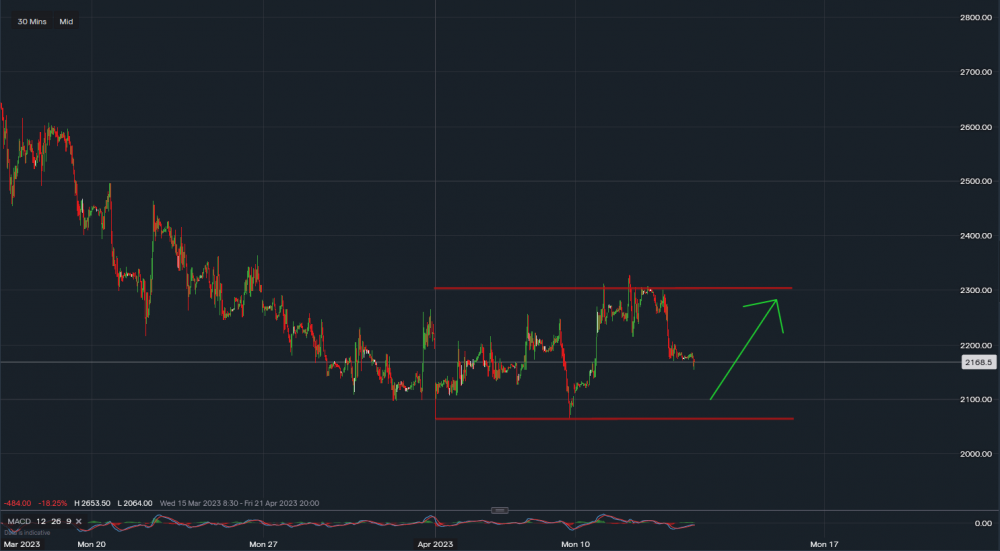
Natural gas - Chart & Data from IG
Natural gas continues to stay within a $0.25c range with the highs being $2.300 and the lows being $2.065. A break of the floor could see natural gas fall towards $2.000 with further support $1.568 (this is the 2020 pandemic low). Towards the upside, a break above $2.300 could see Natural gas push higher towards $3.00. In the short term gas will continue to be volatile, likely sticking within the range because of milder weather through the winter and going into the summer it's too early to tell what demand will be like. The Ukraine war is not having the impact many would have thought because the European winter was mild so reserves are actually above their 5-year average. Therefore this is keeping a lid on prices for the moment, to the downside though, good support for gas sits below because China has finally reopened its economy entirely so demand will increase for gas therefore seeing the lows of $1.568 from 2020 seems unlikely at the moment, however, it cannot be ruled out. Yearly dips like this can provide good medium/long-term positions as history has indicated a recovery from these levels many times before.


 Earnings Calendar
  Economic Calendar
  VAT Calculator
  Tax Free Childcare Calculator
 Percentage Calculator
 Compound Interest Calculator
  Loan Overpayment Calculator
 Mortgage Calculator
 Credit Card Calculator
 Investing
  Economics
 Trading
  Technical Analysis
  Personal Finance
 Calculator


