General Dynamics (GD) Fundamental and Technical Stock Analysis: Can the Defence Prime Keep Outperforming?
$364.70
04 Mar 2026, 12:54
Neutral

Join Minipip Academy and access free courses in investing, trading, economics, and more.
Sign Up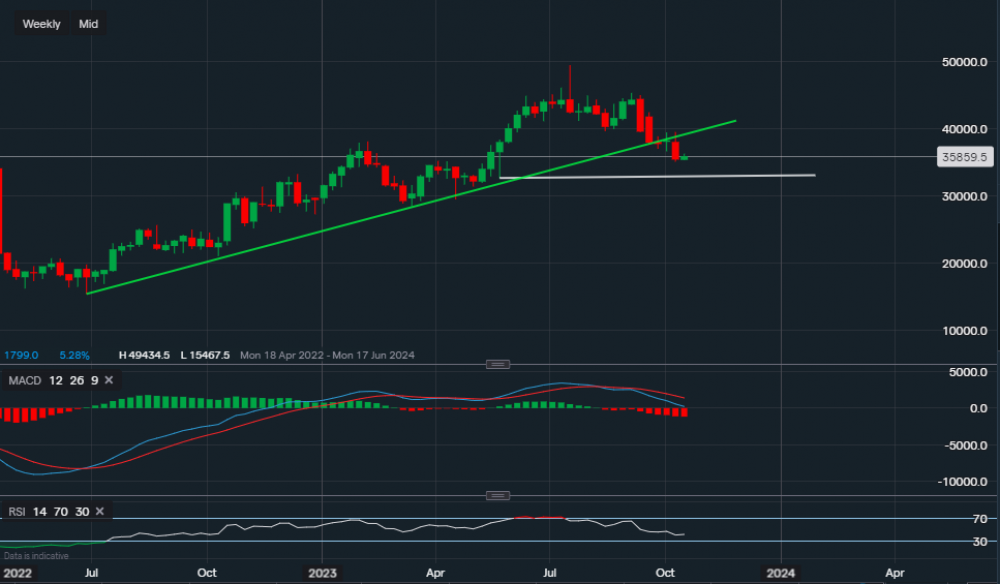
Chart & Data from IG
Netflix is scheduled to report earnings tomorrow, the streaming giant is expected to report an EPS of $3.49 on revenue of $8.54bn. Currently, its stock is trading at around $258.59 a share. Looking at the chart from a technical viewpoint, we can see that the price has broken through the supportive trendline on the weekly timeframe (green), which indicates a bearish price movement. However, there is still support at $327.00 (white trendline). Hence, a break below this support level may then see the price of this stock head lower. Looking at the upside, it would be unreliable for the moment to point out any resistance levels as the bias has turned to neutral. Nevertheless, if any consolidation occurs, then the main resistance area would be the previous support trendline around $397.20. Looking at the technical indicators, the MACD is negative and so is the RSI as it reads 41. So the technical indicators in theory suggest further bearish price movements, but this is not guaranteed.

Tradable assets:
Min.Deposit:
Max Leverage:
FCA:

Rating:


 Earnings Calendar
  Economic Calendar
  VAT Calculator
  Tax Free Childcare Calculator
 Percentage Calculator
 Compound Interest Calculator
  Loan Overpayment Calculator
 Mortgage Calculator
 Credit Card Calculator
 Investing
  Economics
 Trading
  Technical Analysis
  Personal Finance
 Calculator


