General Dynamics (GD) Fundamental and Technical Stock Analysis: Can the Defence Prime Keep Outperforming?
$364.70
04 Mar 2026, 12:54
Neutral

Join Minipip Academy and access free courses in investing, trading, economics, and more.
Sign Up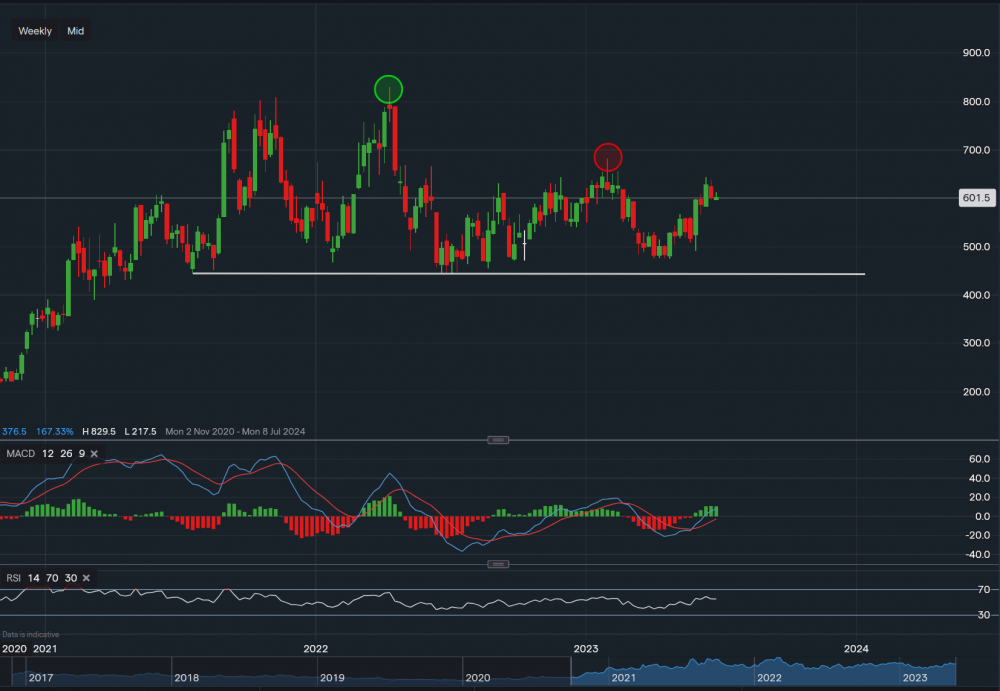
Chart & Data from IG
NexGen currently trading at around C$6.01 a share, we can see that there is a base of support along the white trendline on the chart (C$4.44). A break below this support base could see the price of this stock slide lower with the next support level at C$3.89 and then at C$3.25. From a technical aspect, the current bias seems bullish, with the price approaching tough levels of resistance at C$6.43 and then at C$6.82 (red oval). A break and close above C$6.82 may open the door for a move higher towards the all-time high set in April of last year (C$8.29 – green oval). However, this is more likely in the longer term and only if the price manages to break above the resistance of C$6.82. Looking at the technical indicators, both the MACD and RSI are positive with the RSI reading 55.

Tradable assets:
Min.Deposit:
Max Leverage:
FCA:

Rating:


 Earnings Calendar
  Economic Calendar
  VAT Calculator
  Tax Free Childcare Calculator
 Percentage Calculator
 Compound Interest Calculator
  Loan Overpayment Calculator
 Mortgage Calculator
 Credit Card Calculator
 Investing
  Economics
 Trading
  Technical Analysis
  Personal Finance
 Calculator


