General Dynamics (GD) Fundamental and Technical Stock Analysis: Can the Defence Prime Keep Outperforming?
$364.70
04 Mar 2026, 12:54
Neutral

Join Minipip Academy and access free courses in investing, trading, economics, and more.
Sign Up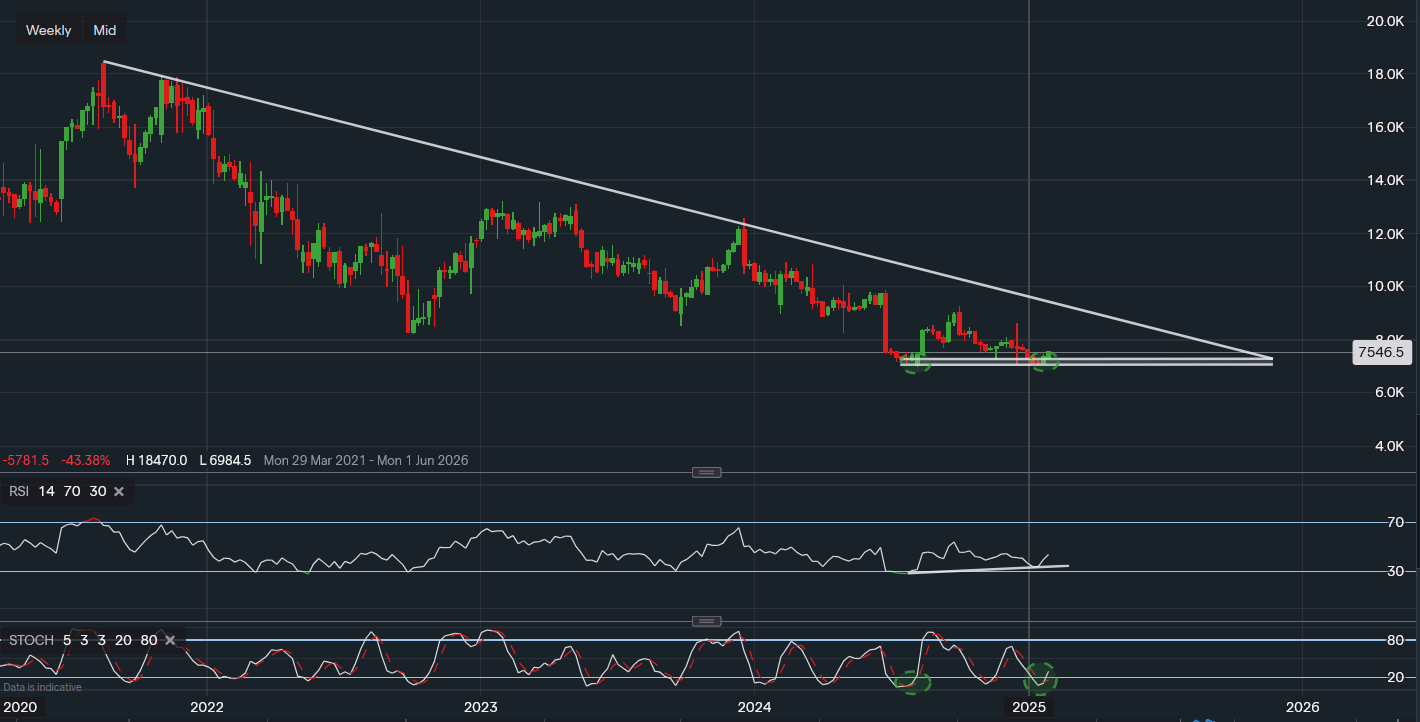
Chart & Data from IG
Nike's share price appears to be forming a double bottom pattern on the weekly chart, a bullish indicator that could attract buyers and drive the price higher. As of now, Nike shares are trading at $75.46, with the potential double bottom highlighted by two green ovals on the chart. This setup suggests a possible re-test of key resistance levels above, making it an interesting opportunity for traders and investors.
Nike's price faces several resistance levels:
A decisive break above the upper trendline could indicate that Nike has finally ended its 3+ year bearish trend. Such a breakout might trigger a surge in momentum, potentially supporting the stock in the short to medium term, until investors assess the company's fundamental outlook for 2025.
On the downside, the critical support zone lies between $69.84-$71. A drop below this range could raise concerns among investors, potentially leading to a deeper sell-off and pushing the stock price even lower.
Key technical indicators reinforce the case for a potential rebound:
RSI (Relative Strength Index):
The RSI is showing a bullish divergence, suggesting medium strength as the stock price has formed an equal low instead of a lower low.
Stochastic Oscillator:
The Stochastic points to oversold conditions, further supporting the possibility of a price increase in the coming weeks.
A breakout above the $89-$90 resistance zone could mark the end of Nike's prolonged bearish trend and open the door to sustained momentum. However, failure to hold the critical support at $69.84-$71 could signal further weakness and heighten investor concerns.
Traders and investors should monitor both technical and fundamental factors closely as 2025 approaches. While the technical setup indicates bullish potential, fundamentals will play a key role in determining the stock's long-term trajectory.

Tradable assets:
Min.Deposit:
Max Leverage:
FCA:

Rating:


 Earnings Calendar
  Economic Calendar
  VAT Calculator
  Tax Free Childcare Calculator
 Percentage Calculator
 Compound Interest Calculator
  Loan Overpayment Calculator
 Mortgage Calculator
 Credit Card Calculator
 Investing
  Economics
 Trading
  Technical Analysis
  Personal Finance
 Calculator


