General Dynamics (GD) Fundamental and Technical Stock Analysis: Can the Defence Prime Keep Outperforming?
$364.70
04 Mar 2026, 12:54
Neutral

Join Minipip Academy and access free courses in investing, trading, economics, and more.
Sign Up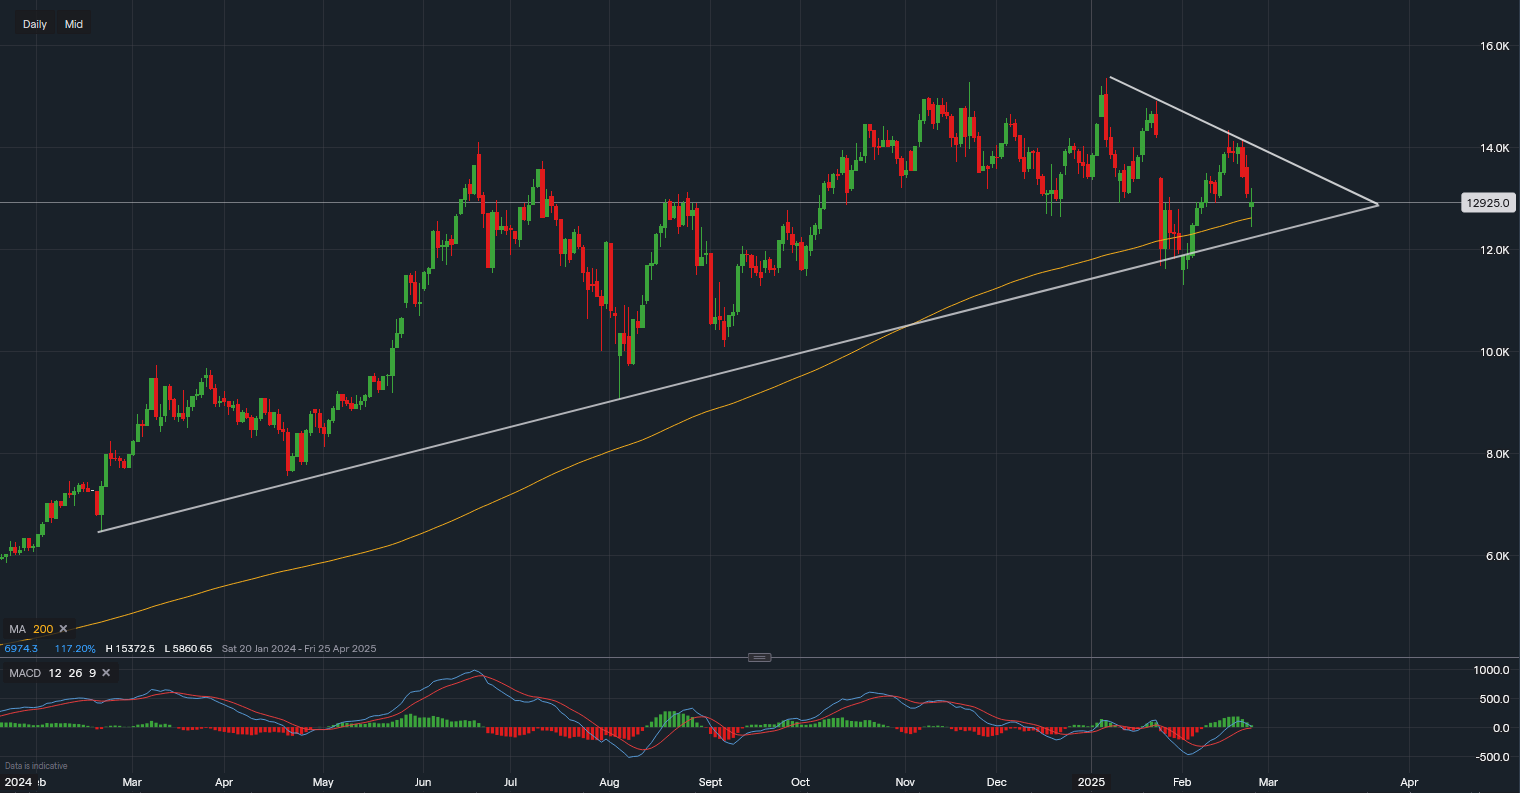
Chart & Data from IG
Nvidia (NASDAQ: NVDA) is set to release its earnings report tomorrow, and all eyes are on its capital expenditure (capex) plans, demand for its latest chips, and rising competition as the industry shifts towards diversification and self-reliance.
Currently, Nvidia's stock is trading around $129.25 per share, testing the 200-day moving average (200MA) in today’s session. Despite briefly dipping below this key level, the stock has managed to hold above it, indicating that investors and traders are positioning ahead of the earnings release.
On the upside:
With Nvidia’s earnings report just around the corner, traders will be closely watching revenue growth, guidance, and AI chip demand. A positive outlook could fuel further gains, while any weakness in earnings or forward guidance could put pressure on the stock.
Will Nvidia break out above $138, or will it test the key support levels below $122? Investors should keep a close eye on tomorrow’s market reaction.

Tradable assets:
Min.Deposit:
Max Leverage:
FCA:

Rating:


 Earnings Calendar
  Economic Calendar
  VAT Calculator
  Tax Free Childcare Calculator
 Percentage Calculator
 Compound Interest Calculator
  Loan Overpayment Calculator
 Mortgage Calculator
 Credit Card Calculator
 Investing
  Economics
 Trading
  Technical Analysis
  Personal Finance
 Calculator


