General Dynamics (GD) Fundamental and Technical Stock Analysis: Can the Defence Prime Keep Outperforming?
$364.70
04 Mar 2026, 12:54
Neutral

Join Minipip Academy and access free courses in investing, trading, economics, and more.
Sign Up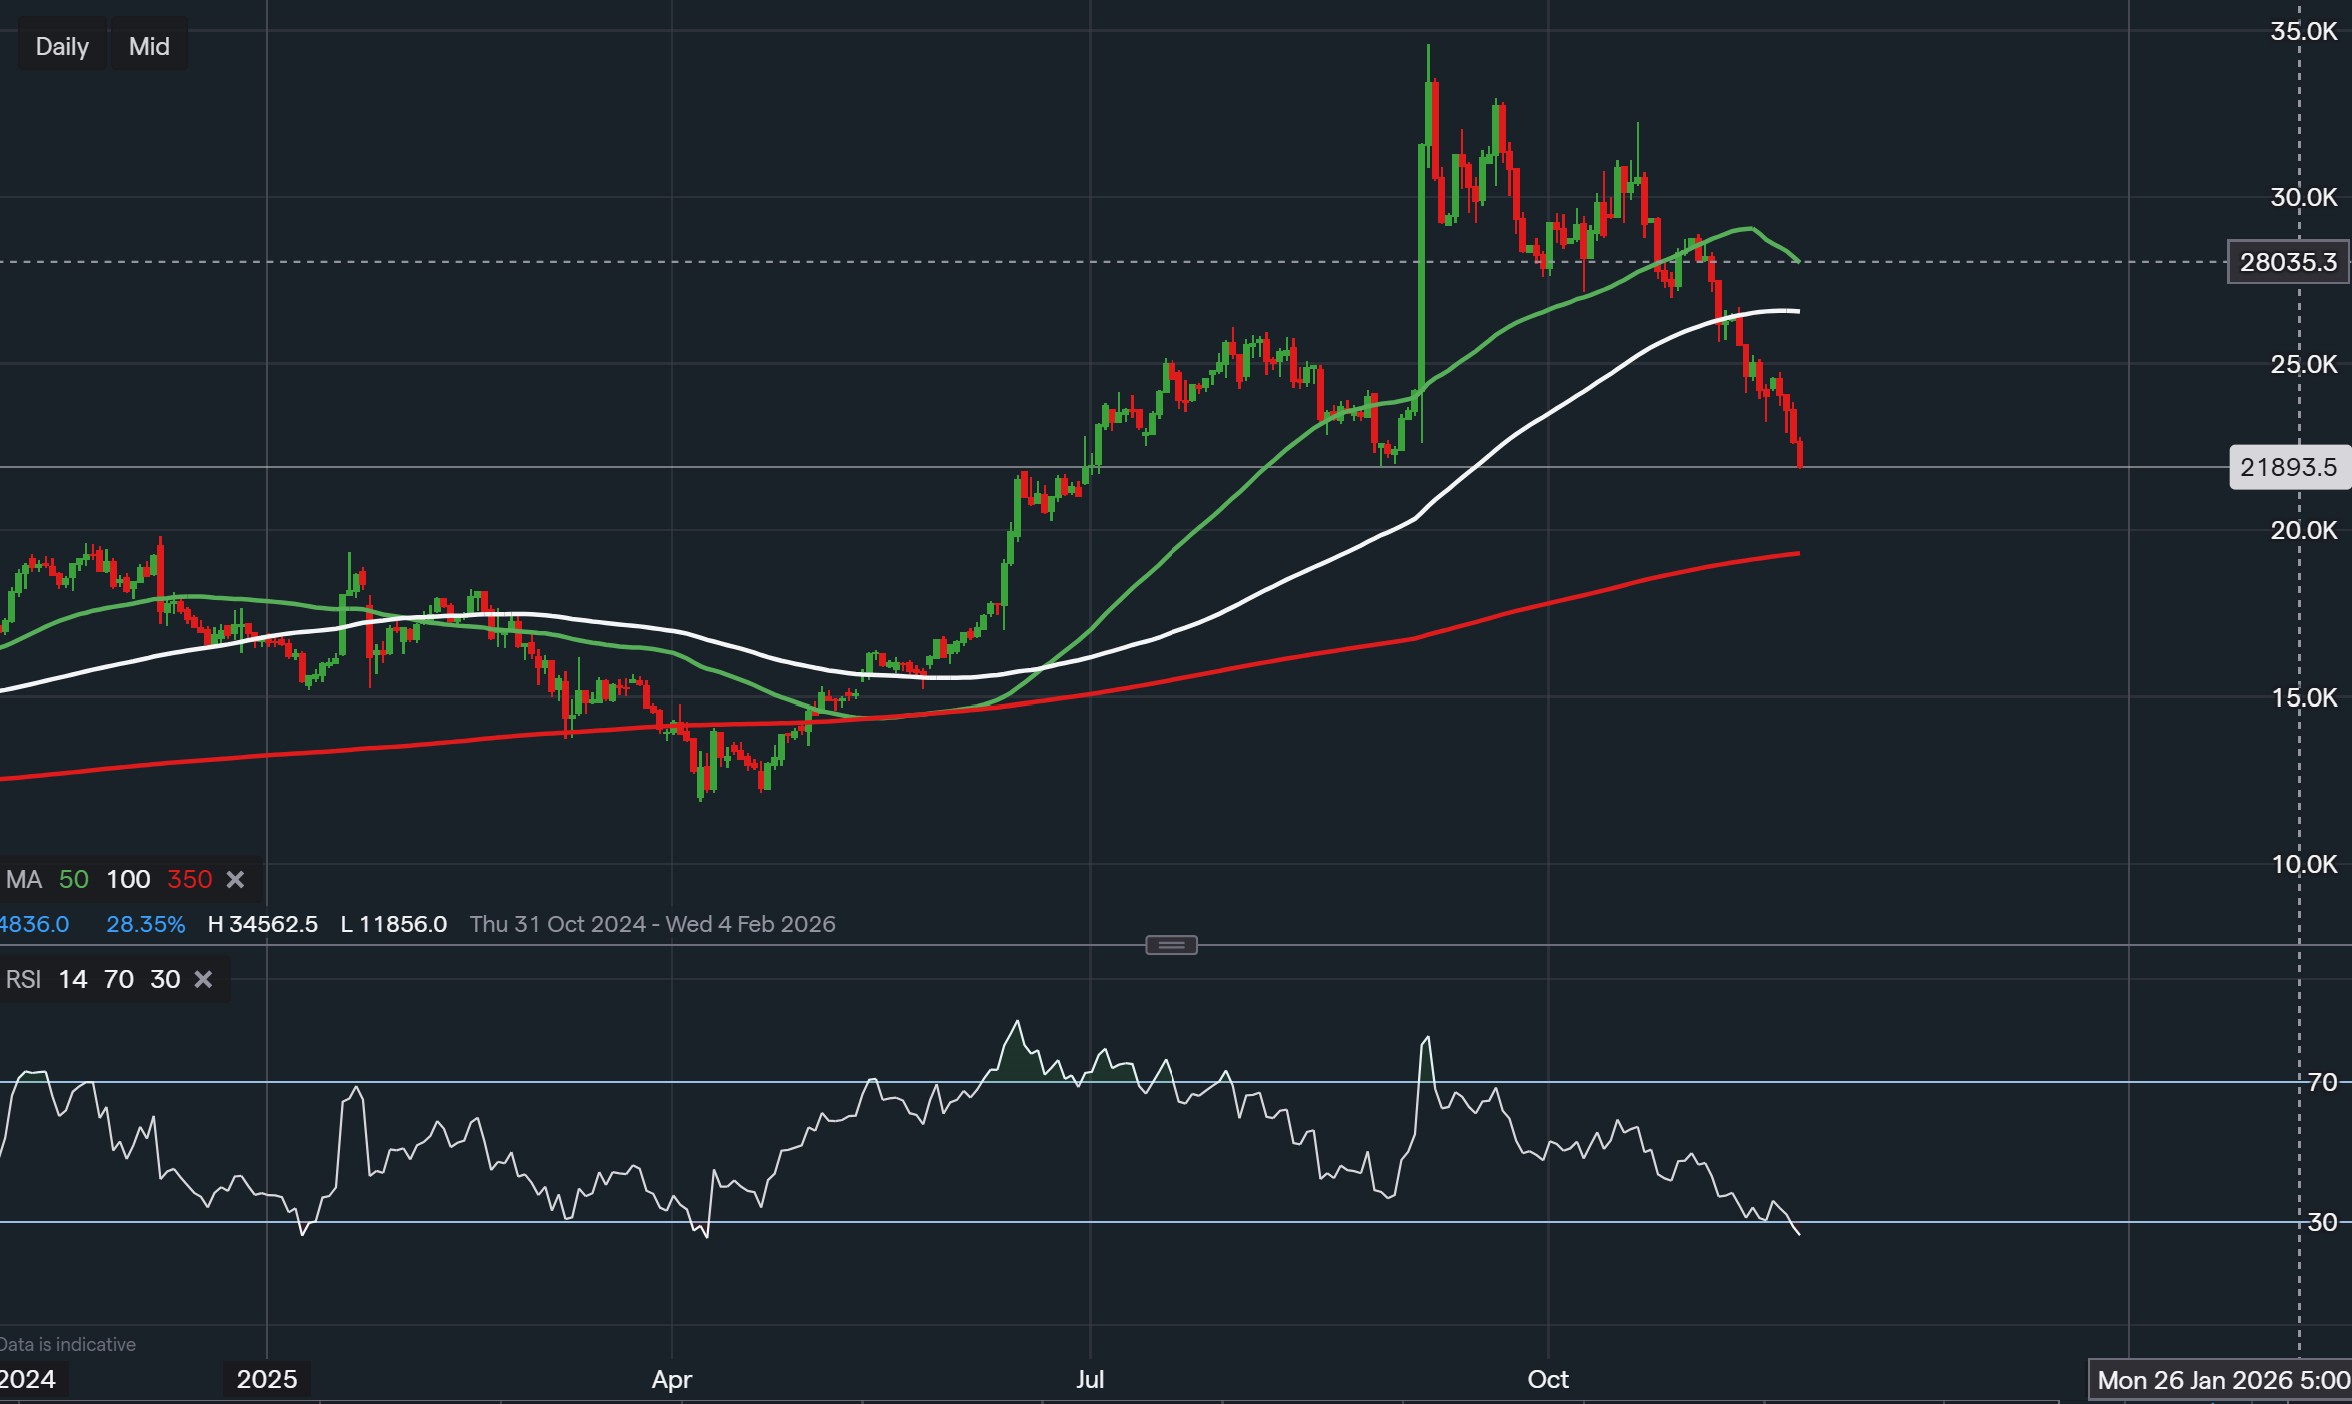
Data from IG - Timeframe - Daily
Market Overview
Oracle Corporation has continued to demonstrate resilience within the technology sector, underpinned by its growing dominance in cloud computing, AI integration, and enterprise database solutions. Throughout most of 2025, the company’s share price has mirrored investor confidence in its strategic transformation and earnings stability. However, as the broader market entered a phase of consolidation in late October, Oracle’s stock began to reflect short-term weakness following months of consistent upward movement.
Uptrend and Resistance Levels
Oracle maintained a solid uptrend throughout much of the year, forming a clear pattern of higher highs and higher lows a classic hallmark of bullish momentum. The share price reached a peak of approximately $354.13, establishing a significant resistance level that prompted profit-taking and slowed buying pressure. This level has since become a key technical barrier, marking the upper boundary of the stock’s recent trading range.
Following this peak, a short-term correction has emerged. The current price action suggests that Oracle may be in the midst of a technical retracement, with potential downside movement targeting the $192.77 region. This area could act as a critical support level, offering traders a potential entry point should the stock find stability and rebound from this zone.
Moving Averages and Momentum Shift
During the bullish phase, Oracle’s price consistently held above its 50-day (green line), 100-day (white line), and 350-day (red line) moving averages, confirming sustained upward momentum. However, after the late October high, the stock broke below the 50-day and 100-day moving averages, signalling a short-term shift in market sentiment. Such a break typically reflects waning bullish energy and growing caution among traders.
Despite the near-term weakness, the price remains above the longer-term 350-day moving average, which indicates that Oracle’s broader bullish structure remains intact. This alignment suggests that while the stock may continue to retrace towards support at $192.77, the underlying long-term trend remains positive. A recovery back above the 50-day and 100-day moving averages would confirm renewed buying momentum and strengthen the case for a rebound toward the previous highs.
RSI and Market Sentiment
The Relative Strength Index (RSI) further supports the notion of a short-term correction. During the rally, Oracle’s RSI moved into overbought territory, surpassing 70 as traders drove prices higher. Following the peak, the RSI fell sharply below 30, moving into oversold territory a sign of intense selling pressure and short-term pessimism.
However, such deeply oversold conditions often precede a technical rebound, as value-oriented traders and long-term investors begin accumulating positions. If the RSI starts to recover toward the 50 level, it would indicate a shift in momentum back to the upside, reinforcing the likelihood of a rebound from the $192.77 support area.
Outlook and Key Considerations
Oracle’s price movement currently suggests a healthy corrective phase within an otherwise strong long-term uptrend. The potential retracement toward $192.77 could serve as a base for renewed upside momentum if buyers return with volume confirmation. For traders, this area may present an attractive technical setup for a short-term reversal, while investors could interpret it as a consolidation opportunity before the next leg higher.
In the broader context, Oracle’s long-term fundamentals driven by its expanding cloud infrastructure business and consistent revenue growth continue to underpin a favourable outlook. Should the stock successfully defend the $192.77 support region and reclaim the 50-day moving average, the next upside target would likely return to the $354.13 resistance zone.
In summary, Oracle’s chart indicates a temporary retracement within a continuing bullish framework. The stock may test support around $192.77 before rebounding back to the upside, supported by strong fundamentals and the potential for renewed buying interest. While short-term volatility remains, the overall technical and structural outlook for Oracle remains constructive heading into 2026.
Disclaimer
This analysis is intended solely for educational and informational purposes. It does not constitute financial advice, investment guidance, or trading recommendations. Market conditions can change rapidly, and all investment decisions should be made based on individual research.

Tradable assets:
Min.Deposit:
Max Leverage:
FCA:

Rating:


 Earnings Calendar
  Economic Calendar
  VAT Calculator
  Tax Free Childcare Calculator
 Percentage Calculator
 Compound Interest Calculator
  Loan Overpayment Calculator
 Mortgage Calculator
 Credit Card Calculator
 Investing
  Economics
 Trading
  Technical Analysis
  Personal Finance
 Calculator


