General Dynamics (GD) Fundamental and Technical Stock Analysis: Can the Defence Prime Keep Outperforming?
$364.70
04 Mar 2026, 12:54
Neutral

Join Minipip Academy and access free courses in investing, trading, economics, and more.
Sign Up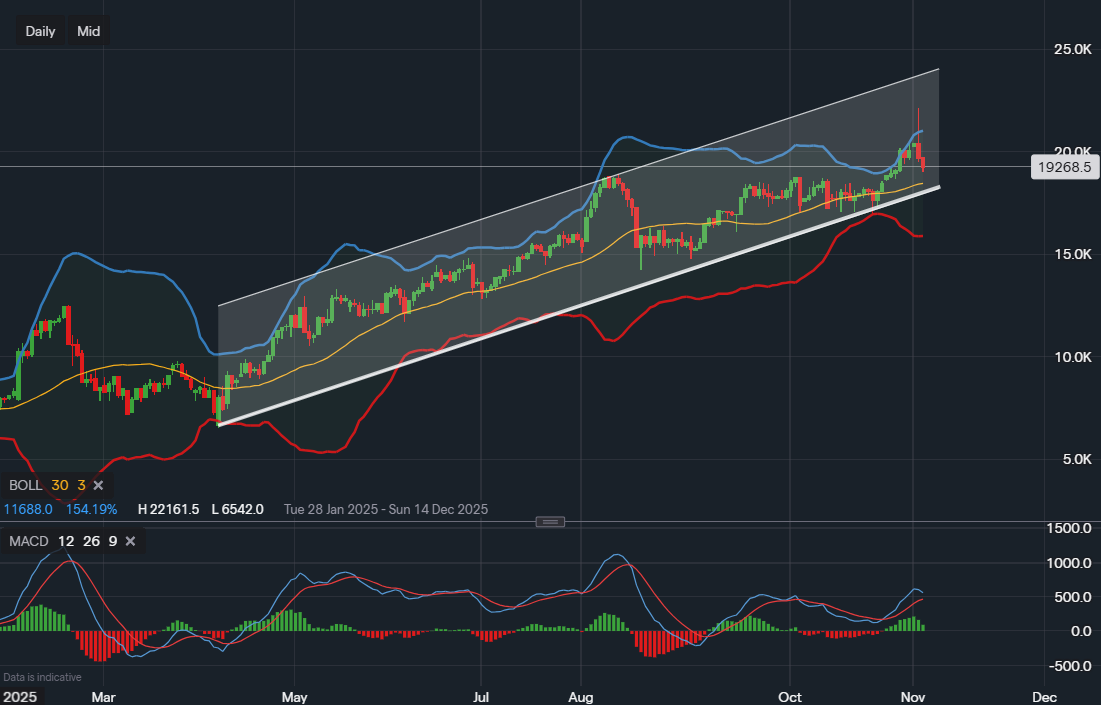
Data from IG : Timeframe - Daily
Palantir Technologies: Balancing Earnings Expectations with Technical Strengths
Palantir Technologies (PLTR) is currently under close scrutiny as it navigates high earnings expectations and exhibits strong technical indicators. The convergence of these factors creates a compelling narrative for traders and investors alike. Palantir's Q3 earnings are anticipated to reveal a significant jump in EPS, potentially doubling from $0.06 last year to $0.12, reflecting substantial operational progress and robust demand.
Earnings and Analyst Outlook
Analysts predict revenue of approximately $1.09 billion, driven by expanding commercial contracts and consistent government projects. However, Palantir's valuation, with a P/E ratio of 666.23 and a forward P/E of 237.96, indicates that investors are anticipating considerable earnings growth, which may already be factored into the stock price. TipRanks analyst ratings are mixed, with a slight inclination toward "Hold," highlighting uncertainty about Palantir's capacity to sustain its rapid growth. Price targets vary widely, from $45 to $215, underscoring the stock's dual nature as both a high-growth innovator and a potentially high-risk investment.

Data from IG : Timeframe - 4H
Technical Analysis Overview
On the daily timeframe, Palantir continues to trade within a well-established ascending channel, showing a strong long-term bullish structure. The stock has maintained a pattern of higher highs and higher lows since early 2025, signaling consistent buying interest and trend strength.
After recently testing the upper boundary of the channel around $221.61, Palantir has entered a corrective phase and is currently trading near $192.68. This area aligns closely with the channel’s midpoint and the 20-day moving average, both of which have previously acted as reliable support levels during short-term pullbacks.
The Bollinger Bands have widened, indicating elevated volatility. The price has moved lower after being rejected from the upper band — a typical move following an extended rally — suggesting a period of consolidation rather than a full trend reversal.
The MACD indicator shows the histogram contracting, with the MACD line edging closer to a potential bearish crossover beneath the signal line. This reflects a temporary loss in bullish momentum, although the broader uptrend remains intact provided the price holds above the lower channel support around $175.00–$180.00.
If Palantir manages to stabilise above $190.00, renewed buying pressure could lift the price back toward $210.00 and potentially $220.00 in the coming sessions. A decisive break below $180.00, however, would suggest a deeper retracement and a possible test of the lower channel boundary.
In summary, Palantir’s daily chart indicates a healthy pullback within a strong long-term uptrend, with the current range offering a potential accumulation opportunity if support holds and momentum begins to recover.
Palantir demonstrates a strong overall uptrend on the 4-hour timeframe, supported by a consistent pattern of higher highs and higher lows since late September. After reaching a recent peak around $221.74, the stock has entered a short-term corrective phase, now trading near $193.04 as it tests the 61.8% Fibonacci retracement level at approximately $189.42.
This area coincides closely with the midline of the Bollinger Bands, historically acting as dynamic support during prior pullbacks within the broader bullish structure. If this level holds, it may signal renewed buyer momentum and a potential rebound toward $201.76 (38.2% Fibonacci) and $209.40 (23.6% Fibonacci) in the near term.
Despite the correction, short-term moving averages remain above longer-term ones, reinforcing the underlying bullish bias. However, the MACD has shown a bearish crossover with red histogram bars emerging, indicating waning momentum in the short term. This suggests the current move is a natural retracement within a broader uptrend rather than a complete reversal, provided price stability remains above the $189.00 region.
Momentum and Key Levels
The Moving Average Convergence Divergence (MACD) indicates positive momentum, although its pace may be stabilizing, suggesting possible short-term consolidation before further gains. Immediate resistance is at the current high, a critical level for continued upward movement. Support zones are apparent at recent consolidation levels, which have previously absorbed selling pressure and facilitated trend continuation. These zones are expected to act as safety nets during pullbacks.
Balancing the AI Advantage and Valuation
Palantir's growth is heavily reliant on its leadership in AI analytics. Its AI-driven Foundry and Gotham platforms are increasingly utilized across various sectors, including government, finance, and global enterprises. The demand for these tools is projected to increase as more industries adopt AI-based decision-making systems. However, the company must consistently deliver strong results to justify its high valuation multiples. Any signs of slowing growth, margin compression, or contract delays could lead to a market correction.
For Traders and Investors
For short-term traders, Palantir's earnings release represents a volatility event, with options markets pricing in potential moves of 10-12%. For long-term investors, Palantir remains an attractive yet speculative growth opportunity. Its strategic importance in AI, defense, and data intelligence is clear, but its current valuation leaves little margin for error. A prudent approach may involve closely monitoring earnings, observing margin expansion, and considering entry on pullbacks rather than chasing strength.
Conclusion
Palantir stands as a leading AI and data analytics company, blending the potential of transformative technology with the challenges of maintaining growth at scale. As earnings are expected to confirm a doubling, the focus shifts to whether the company can convert this momentum into sustained profitability. Technical analysis supports a bullish outlook, but investors must weigh this against valuation concerns and market expectations.
Disclaimer: This analysis is for informational purposes only and should not be considered financial advice. Investors should conduct their own research before making any investment decisions.

Tradable assets:
Min.Deposit:
Max Leverage:
FCA:

Rating:


 Earnings Calendar
  Economic Calendar
  VAT Calculator
  Tax Free Childcare Calculator
 Percentage Calculator
 Compound Interest Calculator
  Loan Overpayment Calculator
 Mortgage Calculator
 Credit Card Calculator
 Investing
  Economics
 Trading
  Technical Analysis
  Personal Finance
 Calculator


