AbbVie (ABBV) Stock Analysis: Humira Decline, New Drug Growth, and Technical Consolidation
$228.47
06 Mar 2026, 17:58
Neutral

Join Minipip Academy and access free courses in investing, trading, economics, and more.
Sign Up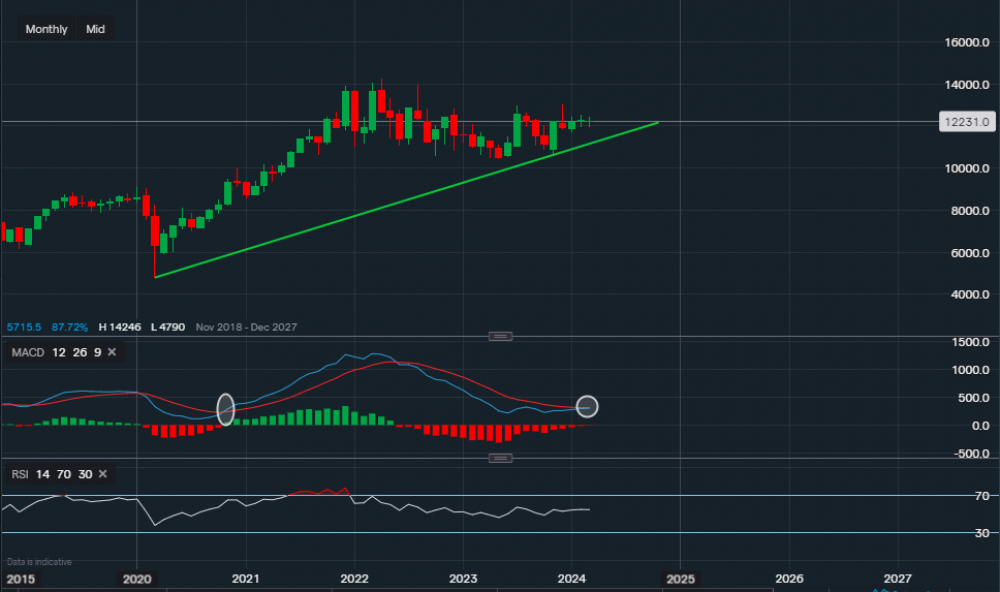
Chart & Data from IG
Paychex is reporting earnings next week, and looking at its stock on the monthly chart, the technical are aligning for a potential move higher. Yesterday, its shares closed at around $122.31 a share. We can see that the stock has support starting from the pandemic period with new support formed last year following the big sell-off in 2022. The initial support for investors here reads $116.76, a break below could see a pullback towards the supportive trendline. Which is currently reading $111.28. Towards the upside, resistance can be found at $124.34, February’s high. A break and close above would create a pathway towards $129-$130, which is last year’s high point. The technical indicators are in theory neutral, but they are swaying towards the positive side of the spectrum. The MACD seems like it is on the verge of turning positive and the RSI is reading 54.

Tradable assets:
Min.Deposit:
Max Leverage:
FCA:

Rating:


 Earnings Calendar
  Economic Calendar
  VAT Calculator
  Tax Free Childcare Calculator
 Percentage Calculator
 Compound Interest Calculator
  Loan Overpayment Calculator
 Mortgage Calculator
 Credit Card Calculator
 Investing
  Economics
 Trading
  Technical Analysis
  Personal Finance
 Calculator


