General Dynamics (GD) Fundamental and Technical Stock Analysis: Can the Defence Prime Keep Outperforming?
$364.70
04 Mar 2026, 12:54
Neutral

Join Minipip Academy and access free courses in investing, trading, economics, and more.
Sign Up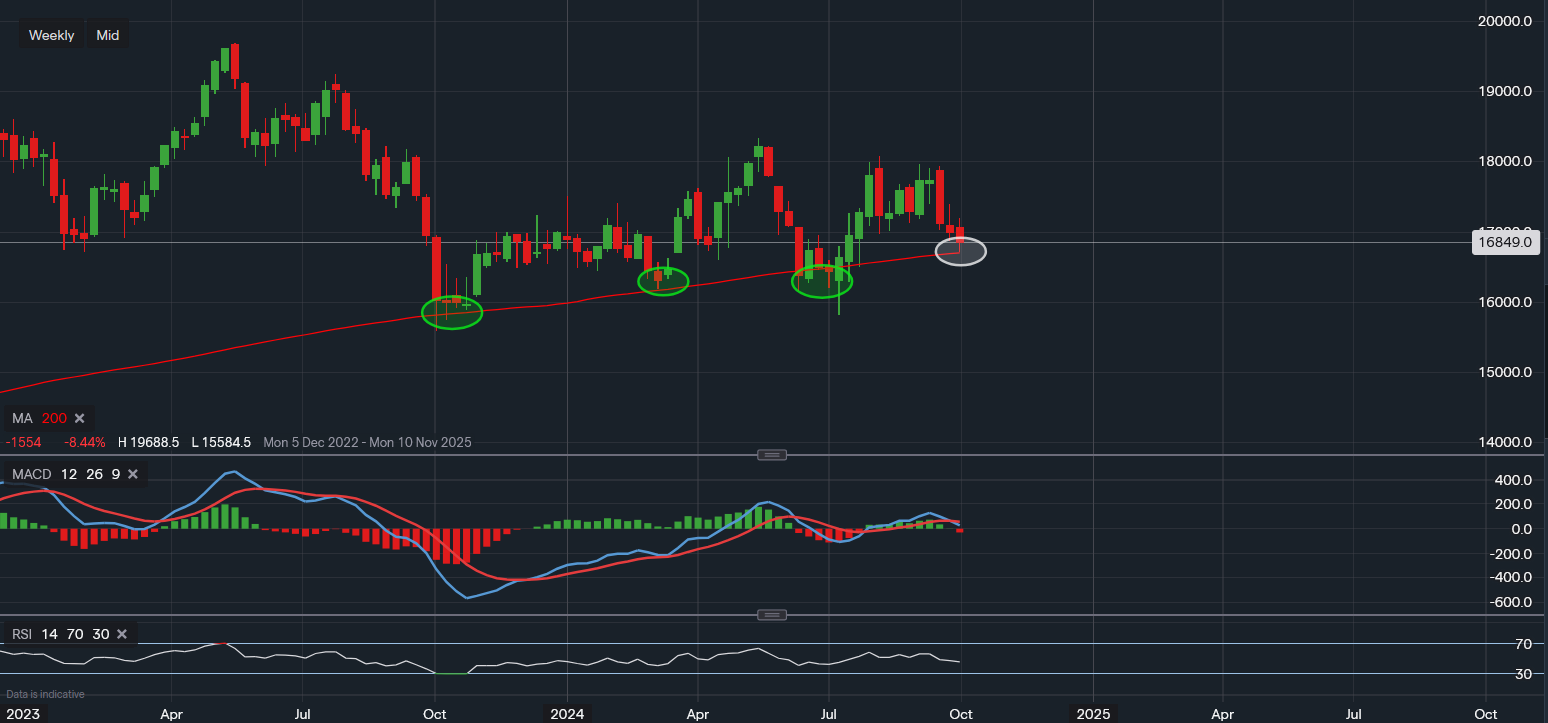
Chart & Data from IG
The 200-day moving average has clearly been acting as the base of support here for PepsiCo on the weekly chart since October of last year. The stock’s share price closed the session yesterday at around $168.49 a share, and once again the price finds itself along the 200MA. Looking at the chart, we can see the support along the 200MA upheld on three separate occasions, with the price bouncing higher each time. However, following the bounce, it seems to be finding resistance around the area of $180-$183. Following the stronger jobs report in the US which indicated that the labour market is more resilient than expected, along with Fed rate cuts (though now smaller) and the data lowering the likelihood of a recession, maybe this stock will finally see some upside in the medium-long term. If the current support in and around the 200MA holds out, or respectively the area of $162-167, then another rally higher towards the resistance could occur. Looking at the upside, a break above the level of $183.38 could be taken as a confirmation that further upside would then be more likely. This would then allow investors to possibly target the price level of $190 followed by $197 (an all-time high). The technical indicators are swaying towards a slightly bearish outlook, but the company is expected to report its earnings next week which can have more of an influence on price action than momentum alone.

Tradable assets:
Min.Deposit:
Max Leverage:
FCA:

Rating:


 Earnings Calendar
  Economic Calendar
  VAT Calculator
  Tax Free Childcare Calculator
 Percentage Calculator
 Compound Interest Calculator
  Loan Overpayment Calculator
 Mortgage Calculator
 Credit Card Calculator
 Investing
  Economics
 Trading
  Technical Analysis
  Personal Finance
 Calculator


