General Dynamics (GD) Fundamental and Technical Stock Analysis: Can the Defence Prime Keep Outperforming?
$364.70
04 Mar 2026, 12:54
Neutral

Join Minipip Academy and access free courses in investing, trading, economics, and more.
Sign Up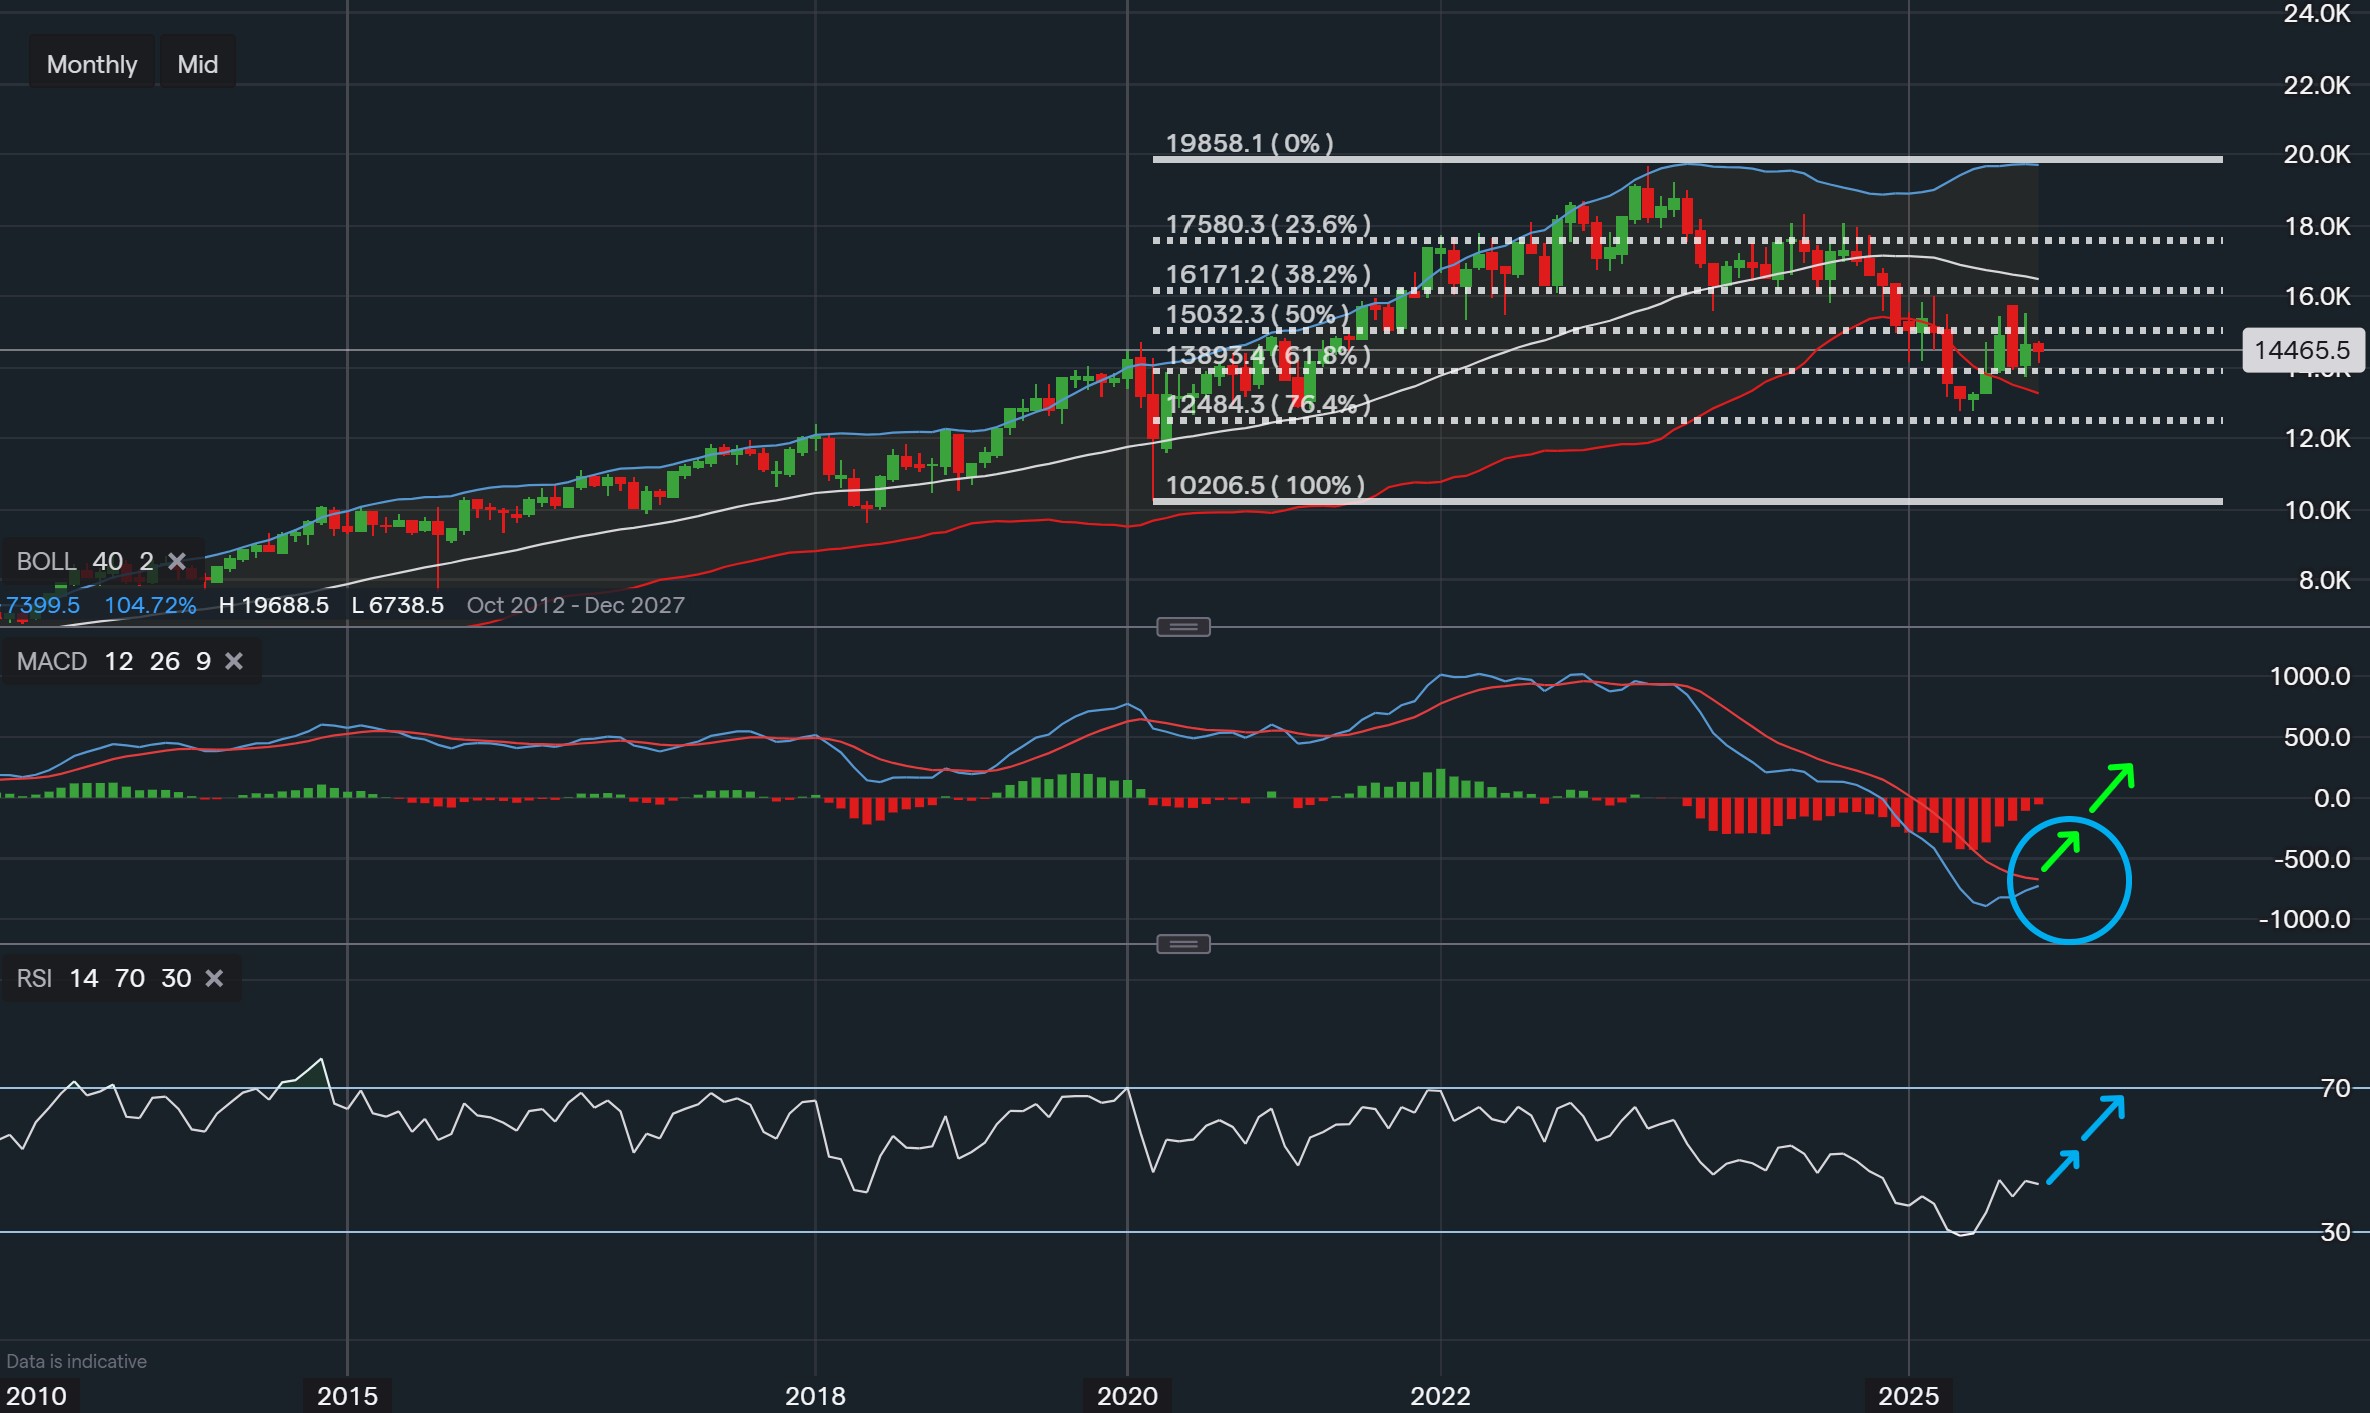
Data from IG - Timeframe - Monthly
Market Overview
PepsiCo currently trades around the $144.39 region, consolidating after a notable corrective phase that tested key Fibonacci retracement levels. The long-term chart illustrates price movement recovering from the 61.8% retracement zone near the $138.97 area — a level that often acts as a technical pivot point within major market cycles. This area aligns closely with the mid-range of the Bollinger Bands, suggesting that price may be attempting to re-establish directional strength after an extended pullback.
Momentum Indicators
From a momentum perspective, the MACD indicator has begun to display early signs of positive divergence, with the signal line crossing upward from deeply negative territory. This early shift, particularly on a monthly timeframe, often indicates the potential for renewed buying interest when confirmed by further price stability. The RSI has also lifted from oversold conditions and is now trending toward the 50–60 range, showing improving sentiment while maintaining enough room for further growth before reaching overbought levels.
Key Technical Zones
The broader structure continues to show consolidation between the $150.32 (50% Fibonacci) and $161.71 (38.2% Fibonacci) regions, which could serve as pivotal checkpoints if upward momentum continues. A sustained close above these areas may reflect strengthening market confidence, while a move back below $138.97 could suggest further consolidation within the current range.
Valuation Perspective
Fundamentally, PepsiCo holds a current P/E ratio of 27.47 and a forward P/E of 16.85, indicating that investors may expect improving returns as long as performance trends remain steady. Despite a -12.35% performance over the past year, the valuation outlook suggests a potential narrowing gap if earnings growth resumes in alignment with forecasts.
Market Sentiment
According to TipRanks data, analyst confidence is split across 13 ratings, with the majority maintaining a Hold stance and only a smaller portion leaning toward Buy. This mixed sentiment suggests that while the technical structure is beginning to show signs of improvement, the broader market remains cautious, awaiting stronger confirmation of direction.
Summary Outlook
In summary, PepsiCo’s chart reflects the early stages of what could evolve into a cyclical recovery phase. The alignment between Fibonacci levels, strengthening MACD momentum, and a recovering RSI invites curiosity from traders and investors watching for stability around the current price region. While not definitive, the setup offers a technically constructive environment worth observing as the stock continues to find its footing within the broader market trend.
Disclaimer
This analysis is intended solely for educational and informational purposes. It does not constitute financial advice, investment guidance, or trading recommendations. Market conditions can change rapidly, and all investment decisions should be made based on individual research.

Tradable assets:
Min.Deposit:
Max Leverage:
FCA:

Rating:


 Earnings Calendar
  Economic Calendar
  VAT Calculator
  Tax Free Childcare Calculator
 Percentage Calculator
 Compound Interest Calculator
  Loan Overpayment Calculator
 Mortgage Calculator
 Credit Card Calculator
 Investing
  Economics
 Trading
  Technical Analysis
  Personal Finance
 Calculator


