General Dynamics (GD) Fundamental and Technical Stock Analysis: Can the Defence Prime Keep Outperforming?
$364.70
04 Mar 2026, 12:54
Neutral

Join Minipip Academy and access free courses in investing, trading, economics, and more.
Sign Up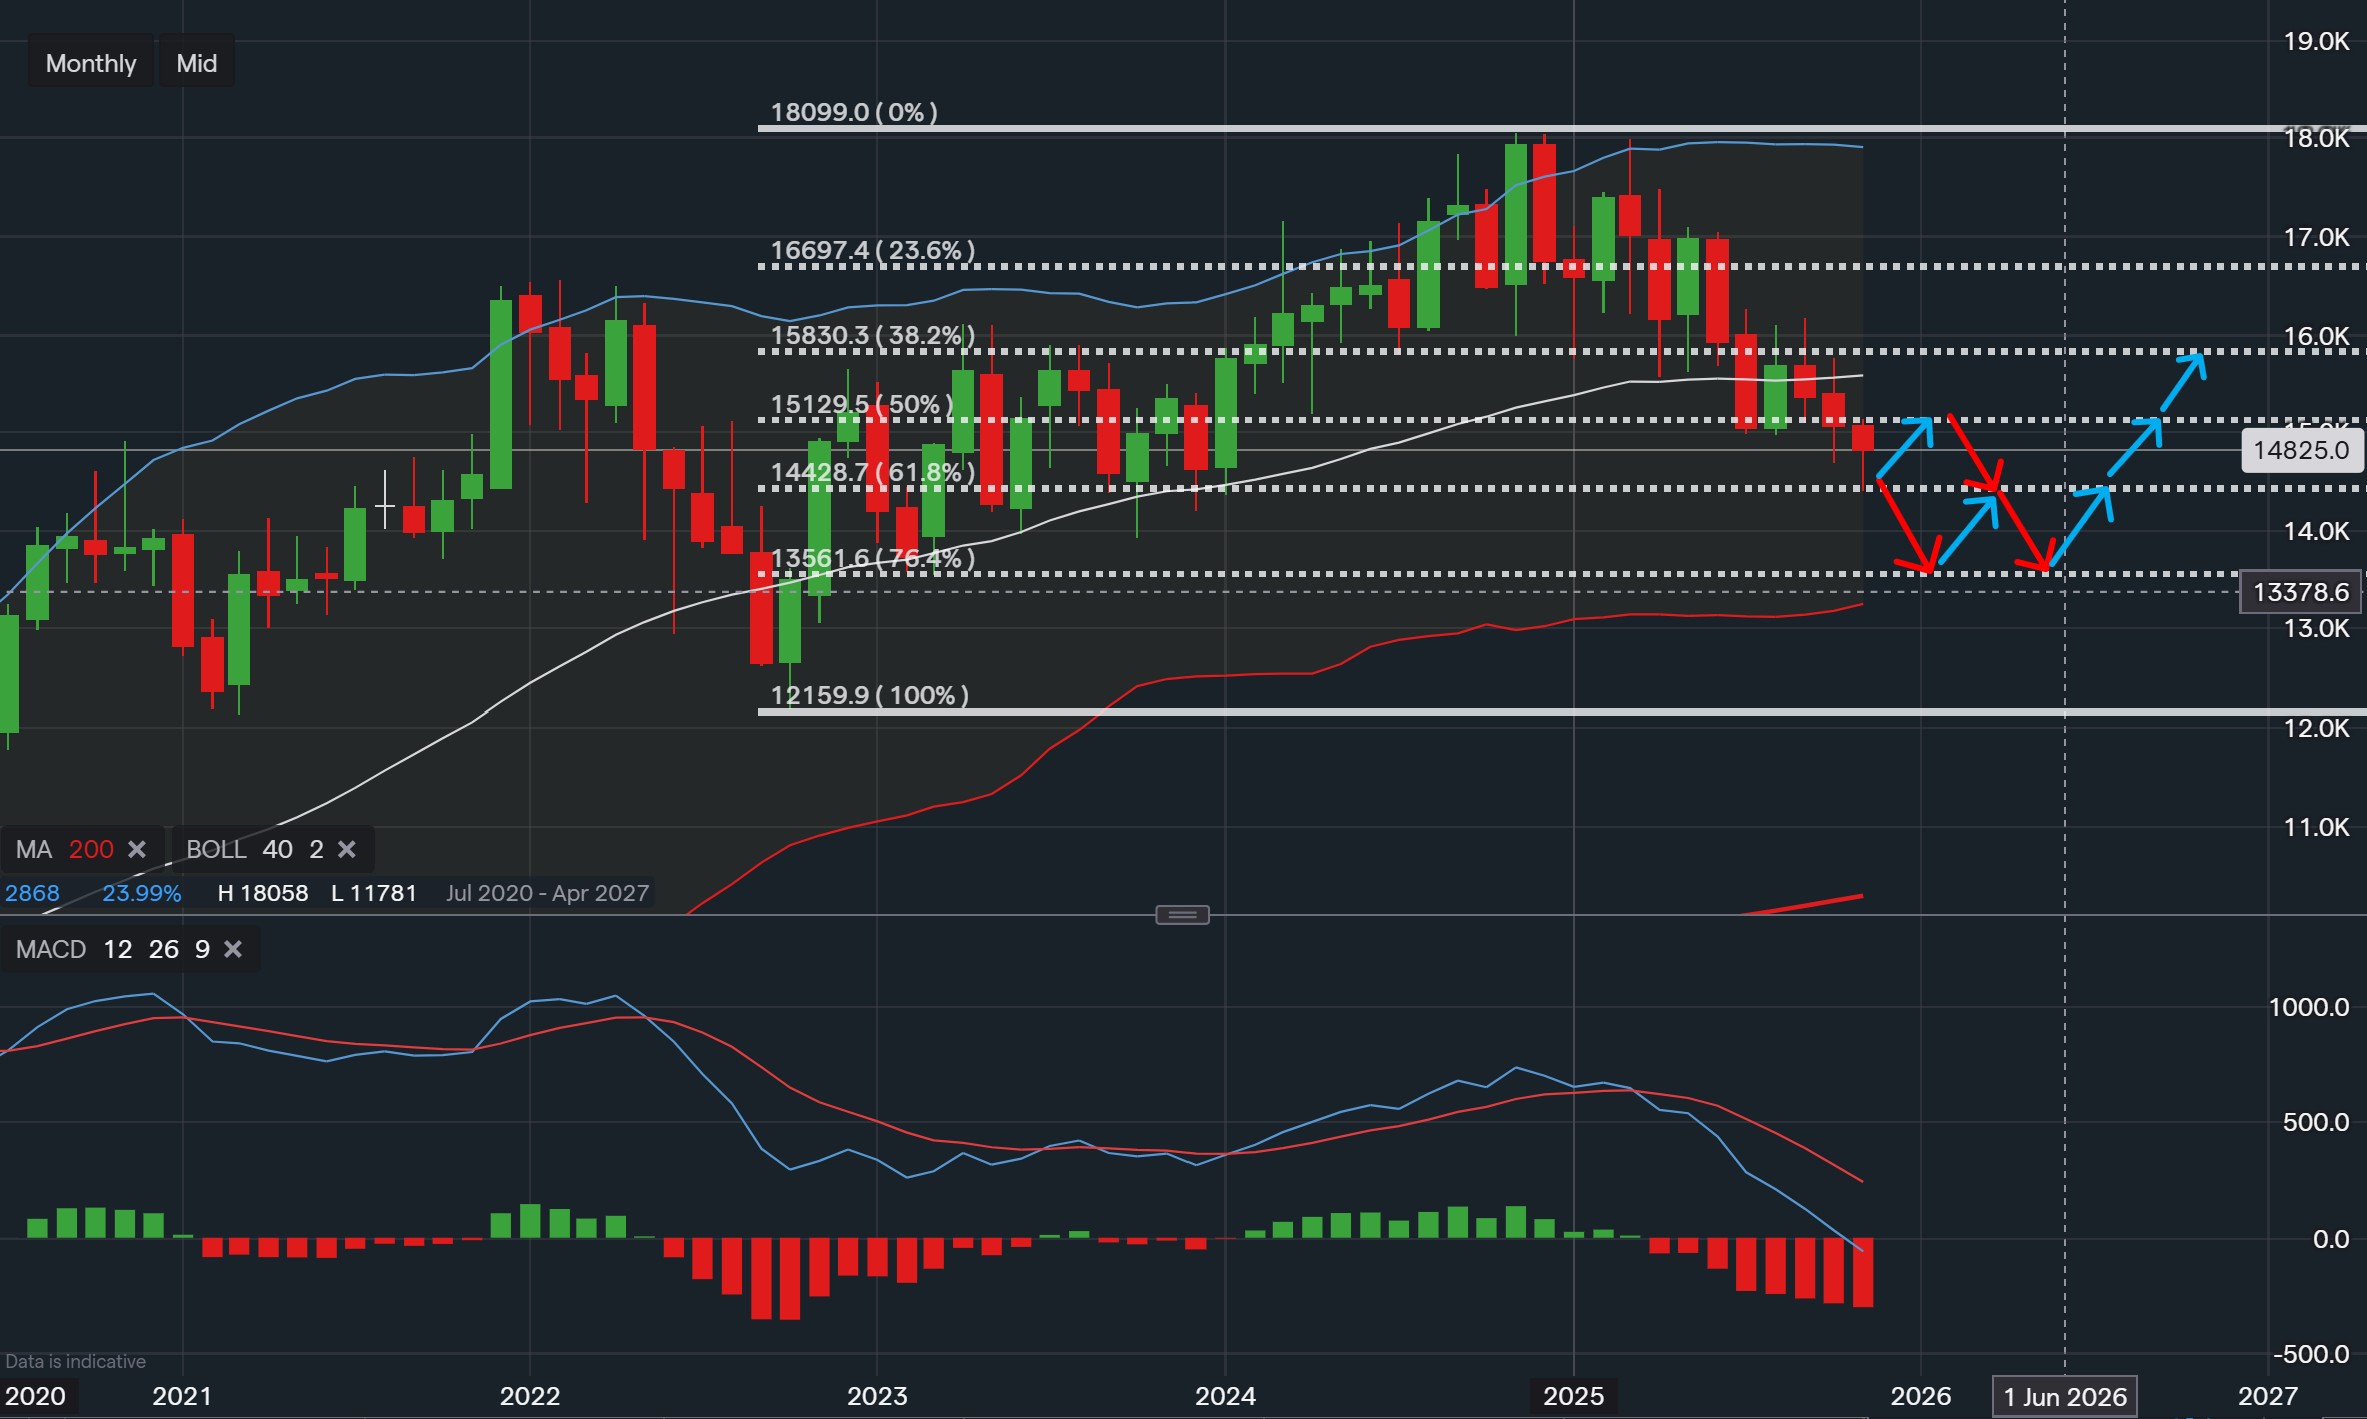
Data from IG - TimeFrame - Monthly
Market Overview
Procter & Gamble currently trades with a P/E ratio of 21.61 and a forward P/E of 19.97, positioning it attractively within the consumer goods sector. These figures highlight the company’s ability to maintain consistent profitability while still offering investors and traders appealing value metrics. The valuation suggests that P&G remains well placed to deliver sustainable earnings growth, appealing to those seeking both short-term stability and long-term capital appreciation potential.
Market Sentiment and Analyst Confidence
Analyst coverage on TipRanks continues to reflect strong confidence in P&G’s outlook, with 18 analysts actively rating the stock. The majority maintain a Buy rating, accompanied by a few Holds, underscoring institutional trust in the company’s fundamentals. This consensus supports the view that P&G remains fundamentally resilient, even as price action consolidates through its technical correction phase.
Technical Chart Perspective
From a technical standpoint, the monthly chart illustrates a clear corrective structure, where price action has respected each Fibonacci retracement level during its recent decline from prior highs. The current movement shows the price stabilizing around the 61.8% Fibonacci level near $148.01, an area often regarded as a decisive zone for potential reversals or base-building.
If momentum continues to weaken, the next meaningful support is observed around $137.00, aligning closely with the 76.4% Fibonacci retracement level. This region could serve as a technical accumulation zone, while a sustained hold above $148.01 may open the door for a gradual recovery toward higher Fibonacci levels as sentiment begins to improve.
Momentum Indicators and Market Dynamics
Momentum indicators reinforce the short-term bearish tone. The MACD line has crossed below the signal line, confirming a bearish crossover, while the histogram bars extend further into negative territory. This alignment indicates increasing downside momentum, consistent with the ongoing pullback phase. However, the structured nature of the correction and the absence of capitulation suggest a controlled market environment rather than a breakdown of trend integrity.
Overall Market Outlook
In summary, P&G’s technical framework reflects a well-structured pullback set against solid underlying fundamentals. The combination of a fair valuation, positive analyst sentiment, and clear technical structure creates a landscape worth monitoring closely. While the near-term bias remains corrective, the long-term picture continues to signal a fundamentally sound company with potential for stabilization around key Fibonacci levels such as $148.01 and $137.00, areas often watched by institutional investors for potential accumulation.
Disclaimer
This analysis is intended solely for educational and informational purposes. It does not constitute financial advice, investment guidance, or trading recommendations. Market conditions can change rapidly, and all investment decisions should be made based on individual research.

Tradable assets:
Min.Deposit:
Max Leverage:
FCA:

Rating:


 Earnings Calendar
  Economic Calendar
  VAT Calculator
  Tax Free Childcare Calculator
 Percentage Calculator
 Compound Interest Calculator
  Loan Overpayment Calculator
 Mortgage Calculator
 Credit Card Calculator
 Investing
  Economics
 Trading
  Technical Analysis
  Personal Finance
 Calculator


