General Dynamics (GD) Fundamental and Technical Stock Analysis: Can the Defence Prime Keep Outperforming?
$364.70
04 Mar 2026, 12:54
Neutral

Join Minipip Academy and access free courses in investing, trading, economics, and more.
Sign Up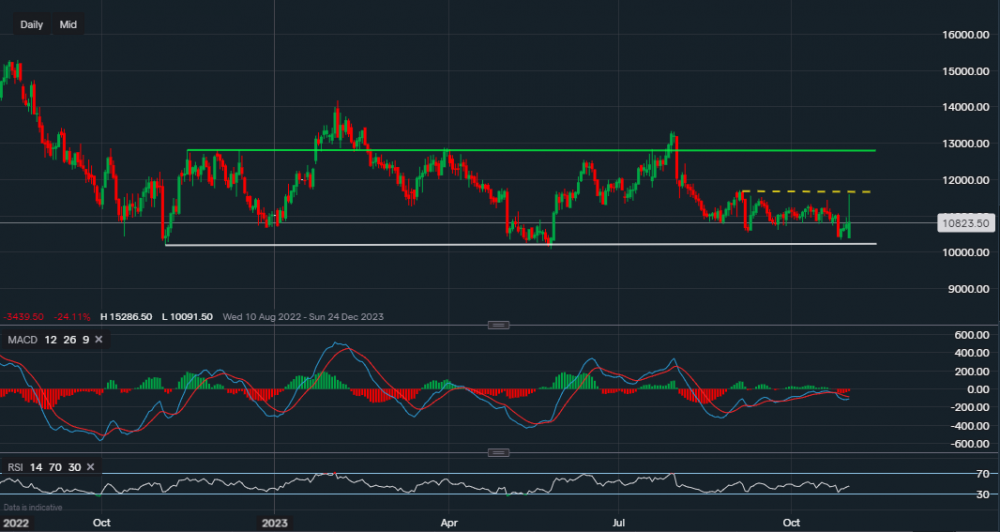
Chart & Data from IG
Looking at QUALCOMM’s stock, it has been rather rangebound since pretty much the same time last year. Currently trading at around $108.23 a share, we can see that the support base sits at $101.94 and has been tested previously demonstrating robustness. Since the beginning of September QC’s price has been rangebound between $103-$117, perhaps the stock is awaiting the quarterly earnings before any clear movement. The key level for investors here is $117.07 (yellow-dotted), a break above it could provide the momentum boost for a move towards the upper half of the channel on the chart (green trendline). A break above the green trendline may begin a trend with the purpose of pushing higher to the levels seen before 2022. In contrast, a negative report followed by a sell-off may be too overpowering for the support base and see a break below. In that scenario, bears would start eyeing up the $90 mark. Heading over to the technical indicators, they are somewhat flat. The MACD is slightly negative but the volume is low and the RSI has just entered a neutral stance as it reads 45.

Tradable assets:
Min.Deposit:
Max Leverage:
FCA:

Rating:


 Earnings Calendar
  Economic Calendar
  VAT Calculator
  Tax Free Childcare Calculator
 Percentage Calculator
 Compound Interest Calculator
  Loan Overpayment Calculator
 Mortgage Calculator
 Credit Card Calculator
 Investing
  Economics
 Trading
  Technical Analysis
  Personal Finance
 Calculator


