General Dynamics (GD) Fundamental and Technical Stock Analysis: Can the Defence Prime Keep Outperforming?
$364.70
04 Mar 2026, 12:54
Neutral

Join Minipip Academy and access free courses in investing, trading, economics, and more.
Sign Up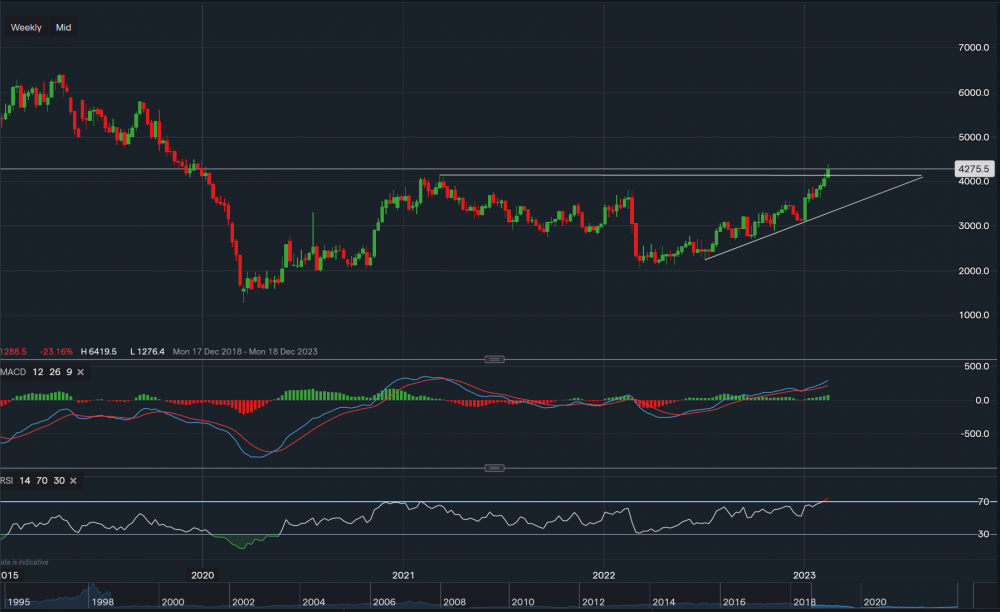
Renault - Chart & Data IG
Renault’s stock has not had the best of times in recent years, falling approximately 87% from April 2018 to the start of the Covid pandemic. Though since the pandemic, consolidation has been found and the stock is now trading at around €42.75 a share, up from €12.76 seen in March 2020. We can see that an ascending triangle was formed on the weekly interval, and a break above its previous high of €41.42 (horizontal trendline) has occurred. If the weekly candle stick closes above this point, this could indicate a possible move higher towards the €49-€50 price range in the mid-long term. The previous resistance level is now acting as support at €41.42, a break below this level could see the price decline towards levels sitting at €38.55 and then at €37.12. And a break below those levels may revert the outlook from positive to neutral. Looking at the technical indicators, MACD is positive and so is RSI as it reads 74. Note to investors, RSI has entered the ‘overbought’ boundary, hence, there could be a short-term dip before a bounce higher continues. Of course, this is also dependent on other factors, such as the state of the economy and the earnings of the company in months to come.


 Earnings Calendar
  Economic Calendar
  VAT Calculator
  Tax Free Childcare Calculator
 Percentage Calculator
 Compound Interest Calculator
  Loan Overpayment Calculator
 Mortgage Calculator
 Credit Card Calculator
 Investing
  Economics
 Trading
  Technical Analysis
  Personal Finance
 Calculator


