General Dynamics (GD) Fundamental and Technical Stock Analysis: Can the Defence Prime Keep Outperforming?
$364.70
04 Mar 2026, 12:54
Neutral

Join Minipip Academy and access free courses in investing, trading, economics, and more.
Sign Up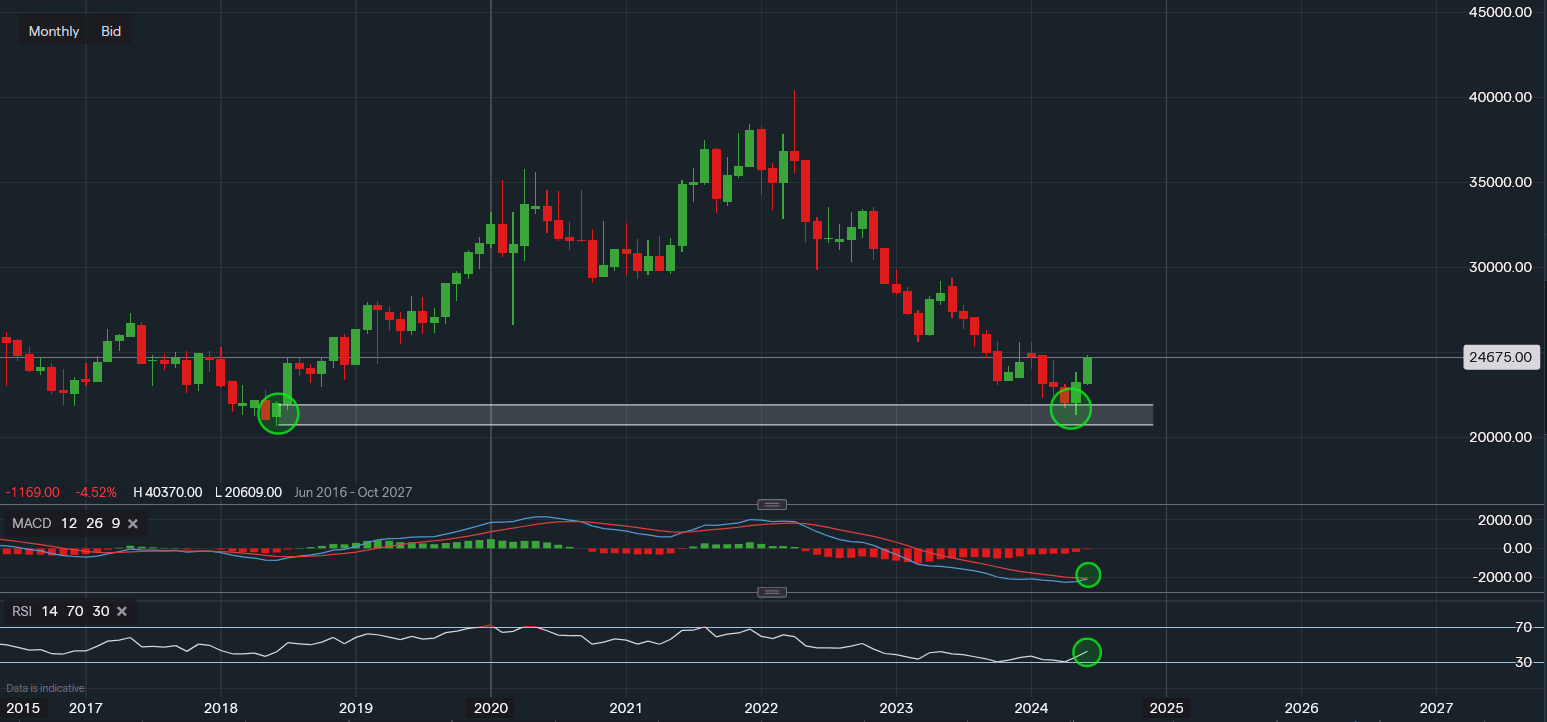
Chart & Data from IG
Taking a look at Roche as the selling may now be overdone and a potential double-bottom is at play. Currently, the healthcare giant’s share price trades at around CHF246.75 a share. The monthly chart shows that support in May 2018 has been somewhat tested with this April forming an engulfing candlestick. The first sign of a bullish indication. Following May’s strong finish, the resistance here is now the level of CHF255.64. A break above could pave the way towards CHF270-290. What offers an incentive here for investors is the positioning of the technical indicators, the MACD seems like it may soon turn positive and the RSI is on the rise from oversold conditions, reading 42. This suggests a possible shift in momentum. The key support here is the area between CHF206-212. Only a break below CHF206 would signal that further downside is likely.

Tradable assets:
Min.Deposit:
Max Leverage:
FCA:

Rating:


 Earnings Calendar
  Economic Calendar
  VAT Calculator
  Tax Free Childcare Calculator
 Percentage Calculator
 Compound Interest Calculator
  Loan Overpayment Calculator
 Mortgage Calculator
 Credit Card Calculator
 Investing
  Economics
 Trading
  Technical Analysis
  Personal Finance
 Calculator


