General Dynamics (GD) Fundamental and Technical Stock Analysis: Can the Defence Prime Keep Outperforming?
$364.70
04 Mar 2026, 12:54
Neutral

Join Minipip Academy and access free courses in investing, trading, economics, and more.
Sign Up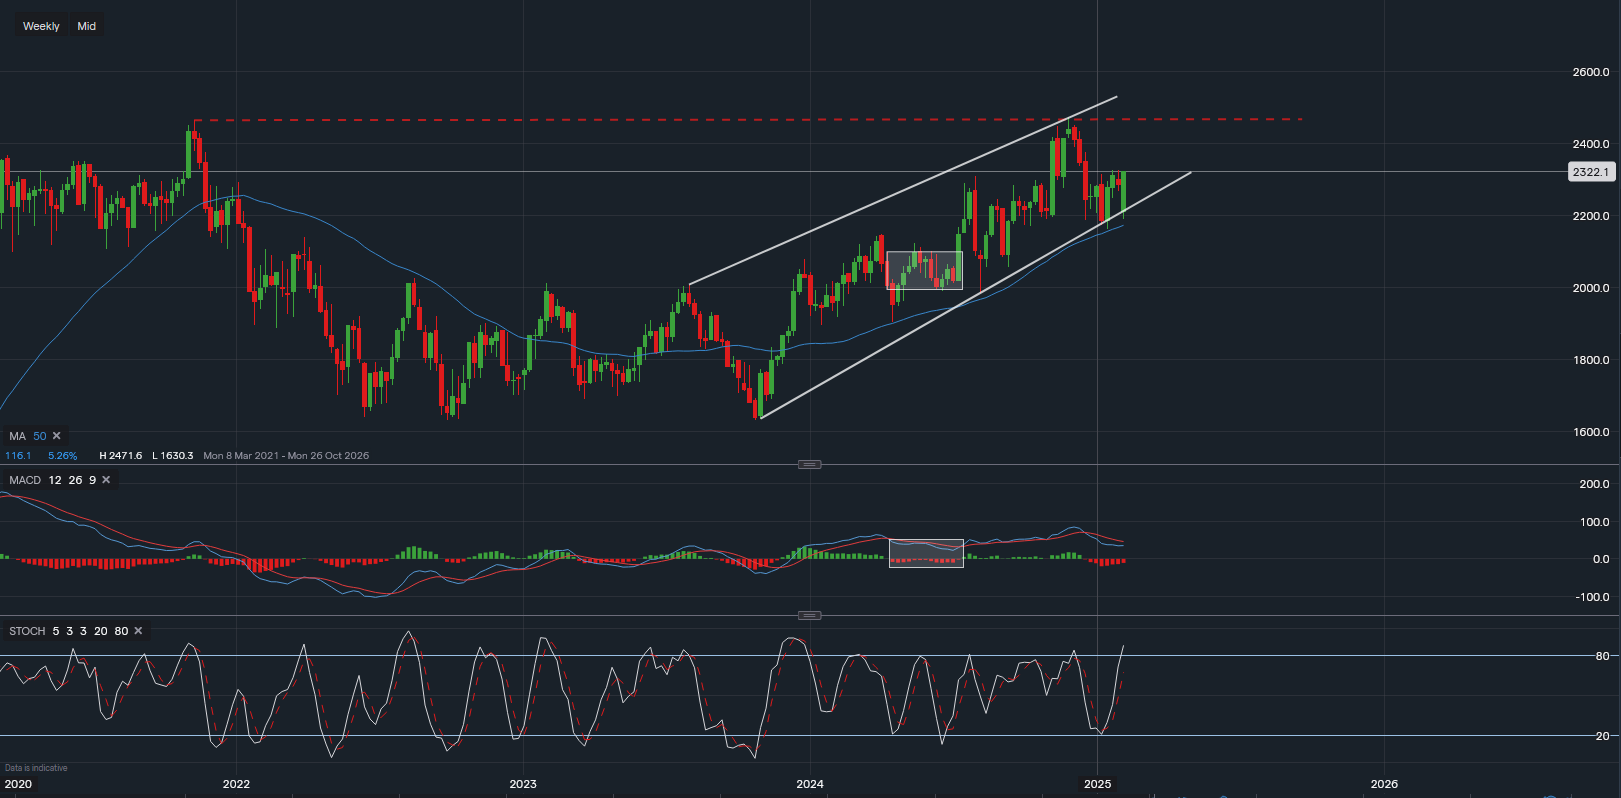
Chart & Data from IG
The Russell 2000 index appears well-supported for a potential move higher based on current price action. However, momentum indicators suggest caution, as short-term volatility could weigh on prices.
As of today’s European session (pre-market for the US), the small-cap index is trading around 2,322. While bullish signals are emerging, traders should closely monitor technical indicators before confirming a breakout.
The index has established a clear support level along its trendline support at 2,160, which has attracted buyers and pushed prices higher. A potential break above minor resistance at 2,326 could open the door for further gains.
A sustained breakout above 2,326 could attract more buyers and increase bullish momentum, though a rally towards 2,471 is not guaranteed without further confirmation.
While price action looks promising, momentum indicators show mixed signals:
MACD Indicator:
Stochastic Indicator:
Given these indicators, traders should wait for stronger bullish confirmation before entering long positions or prepare for near-term volatility.
If support levels fail, a break below 2,200, and especially 2,160, would indicate increased downside risk, potentially leading to further losses.
✅ Russell 2000 is holding key support at 2,160, with a potential breakout above 2,326.
✅ MACD remains bearish, suggesting possible sideways movement.
✅ Stochastic is in overbought territory, indicating short-term caution.
✅ A break below 2,200 or 2,160 could trigger further downside pressure.
The Russell 2000 index is at a critical technical juncture, with bullish potential but near-term risks. Traders should monitor momentum indicators closely and wait for confirmation before committing to a position.

Tradable assets:
Min.Deposit:
Max Leverage:
FCA:

Rating:


 Earnings Calendar
  Economic Calendar
  VAT Calculator
  Tax Free Childcare Calculator
 Percentage Calculator
 Compound Interest Calculator
  Loan Overpayment Calculator
 Mortgage Calculator
 Credit Card Calculator
 Investing
  Economics
 Trading
  Technical Analysis
  Personal Finance
 Calculator


