General Dynamics (GD) Fundamental and Technical Stock Analysis: Can the Defence Prime Keep Outperforming?
$364.70
04 Mar 2026, 12:54
Neutral

Join Minipip Academy and access free courses in investing, trading, economics, and more.
Sign Up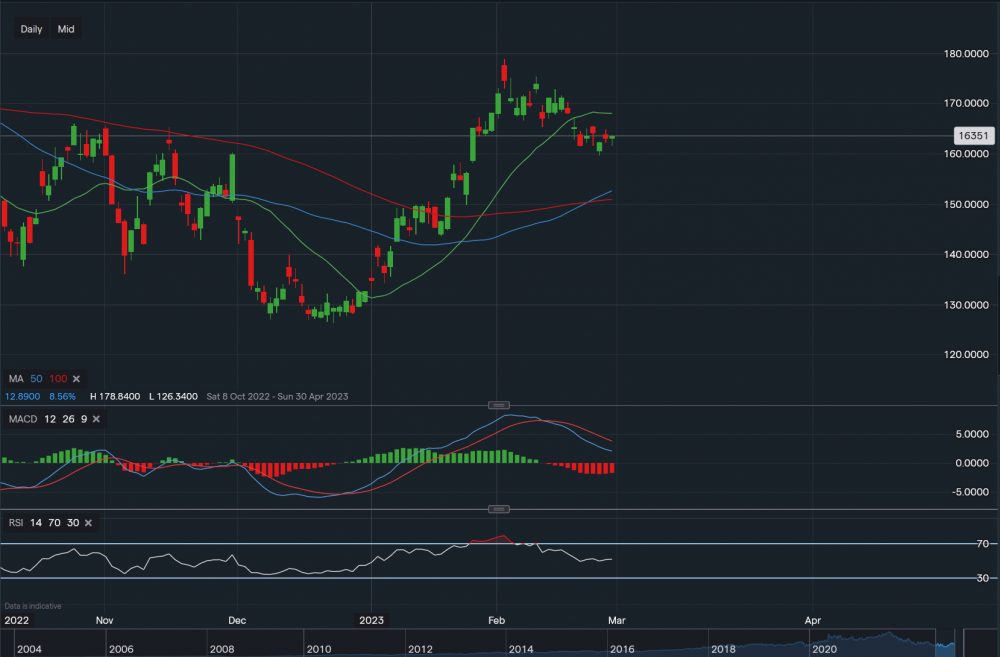
Salesforce - Chart & Data from IG
From a technical perspective, the Salesforce stock is trading at around $163.51 a share. We can see that last week on the daily interval, the price dipped below the 20-day moving average. The longer-term bias remains bullish, but a slight retracement may continue in the short term. Hence, support below sits at $159.65. A break below $159.65 could see the price decline further towards the 50 (currently $152.64) and 100-day (currently $150.90) moving averages. Nevertheless, tomorrow, Salesforce is expected to report quarterly earnings of $1.36 on revenue of $8 billion. A positive report may see its stock’s price edge higher, therefore, resistance above sits at $164.77 then at $165.47 then at $168.01 (20-day moving average). A break and close above the 20-day MA could see a continuation of this bullish trend since the start of the year. Taking a look at the indicators, MACD is negative but RSI is neutral as it reads 52. Salesforce’s stock is up 17% since the start of 2023, after losing around 48% of its value in 2022.


 Earnings Calendar
  Economic Calendar
  VAT Calculator
  Tax Free Childcare Calculator
 Percentage Calculator
 Compound Interest Calculator
  Loan Overpayment Calculator
 Mortgage Calculator
 Credit Card Calculator
 Investing
  Economics
 Trading
  Technical Analysis
  Personal Finance
 Calculator


