General Dynamics (GD) Fundamental and Technical Stock Analysis: Can the Defence Prime Keep Outperforming?
$364.70
04 Mar 2026, 12:54
Neutral

Join Minipip Academy and access free courses in investing, trading, economics, and more.
Sign Up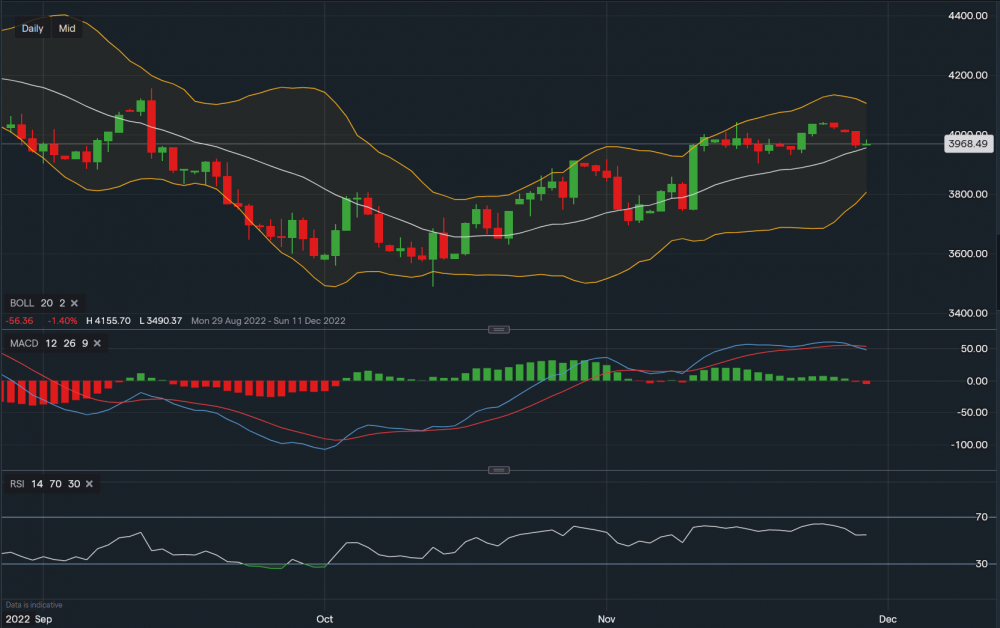
S&P 500 - Chart & Data from IG
Taking a look at the S&P 500 on a daily timeframe, from a technical aspect the index is currently trading around 3968 with support below at 3956, which corresponds with the middle moving average of the Bollinger Bands. A break below the middle MA of the Bollinger Bands could see the index head towards the 3807 level, which matches the lower band of the Bollingers. Although, this is more likely towards the back end of this week/start of next week. Towards the upside, if the support level holds, resistance sits at 3986 then at 4007 then a key point at 4043. A break above the 4043 level may see the S&P 500 climb higher towards 4100-4150. Looking at the indicators, MACD has turned negative and RSI is slightly positive but faltering towards a neutral stance.


 Earnings Calendar
  Economic Calendar
  VAT Calculator
  Tax Free Childcare Calculator
 Percentage Calculator
 Compound Interest Calculator
  Loan Overpayment Calculator
 Mortgage Calculator
 Credit Card Calculator
 Investing
  Economics
 Trading
  Technical Analysis
  Personal Finance
 Calculator


