General Dynamics (GD) Fundamental and Technical Stock Analysis: Can the Defence Prime Keep Outperforming?
$364.70
04 Mar 2026, 12:54
Neutral

Join Minipip Academy and access free courses in investing, trading, economics, and more.
Sign Up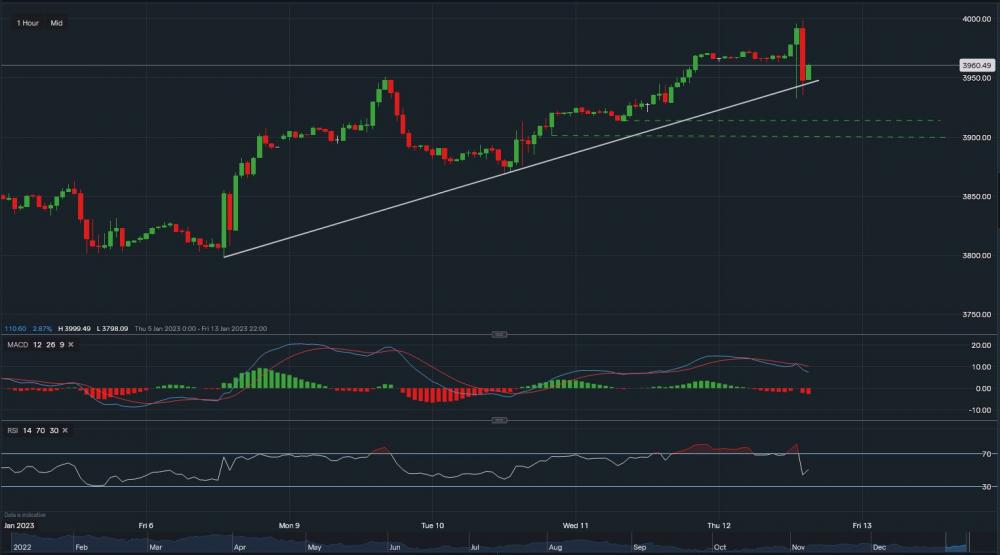
S&P 500 - Chart & Data from IG
The consumer price index met the forecasts of experts, yet the S&P 500 saw a drastic decline. Perhaps it was overbought to begin with. From a technical aspect, it is currently trading at around 3,960 with key support below at 3,945, which corresponds with the white trendline. A break below the trendline could see the index fall further towards the support levels at 3,913 (higher dotted trendline) and then at 3,901 (2nd lower dotted trendline). However, as the figures showed that inflation is slowing, the index may do a reversal. Hence, resistance sits at 3,973 then at 3,978 and finally a key level at 3,999. A break above the key resistance could see the index climb towards 4,040-4,050. Looking at the indicators, MACD is currently negative but RSI is positive as it reads 54


 Earnings Calendar
  Economic Calendar
  VAT Calculator
  Tax Free Childcare Calculator
 Percentage Calculator
 Compound Interest Calculator
  Loan Overpayment Calculator
 Mortgage Calculator
 Credit Card Calculator
 Investing
  Economics
 Trading
  Technical Analysis
  Personal Finance
 Calculator


