General Dynamics (GD) Fundamental and Technical Stock Analysis: Can the Defence Prime Keep Outperforming?
$364.70
04 Mar 2026, 12:54
Neutral

Join Minipip Academy and access free courses in investing, trading, economics, and more.
Sign Up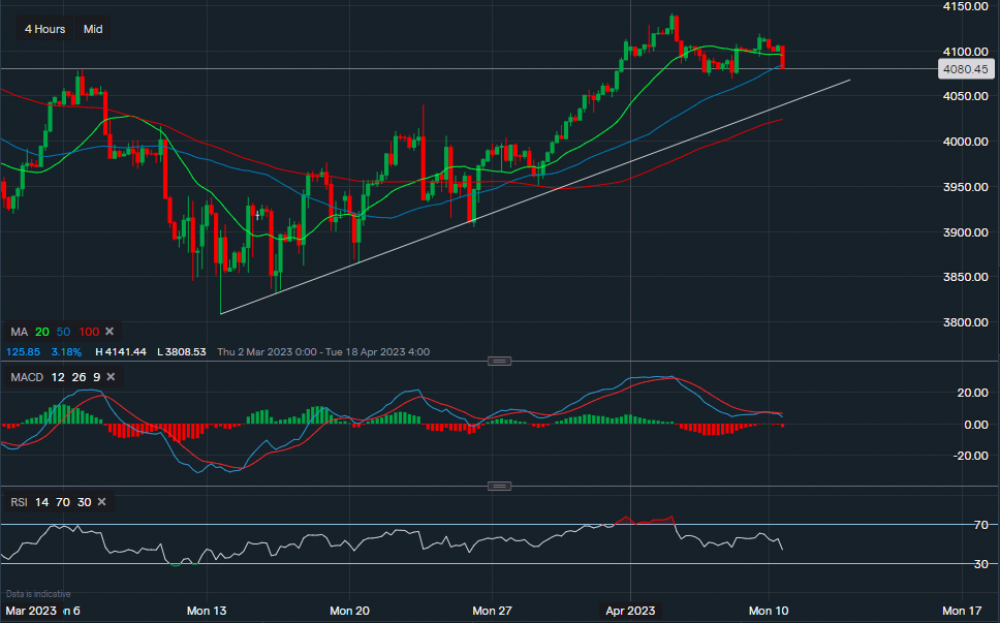
Chart & Data from IG
The S&P 500 index is trading at around 4080. Looking at the 4-hourly interval, we can see that the index has dipped below the 50-day moving average (4084). A close below the moving average may see the S&P slide further towards the support sitting along the trendline at 4045. This also correlates with the 100-day moving average, which currently sits at 4024. With the 100-day MA located just below the trendline, investors should note that a break below the trendline does not always mean a reversal trend is in play. Only a break and close below the 100-day MA may confirm more downside, Then again, this is not always guaranteed as false breaks can be common. If the S&P can consolidate around the support levels, then resistance above is sitting at 4107 then at 4118. Only a move above 4118 would suggest that further upside is potentially upcoming. Looking at the technical indicators, MACD is currently negative and so is RSI as it reads 43.


 Earnings Calendar
  Economic Calendar
  VAT Calculator
  Tax Free Childcare Calculator
 Percentage Calculator
 Compound Interest Calculator
  Loan Overpayment Calculator
 Mortgage Calculator
 Credit Card Calculator
 Investing
  Economics
 Trading
  Technical Analysis
  Personal Finance
 Calculator


