NVIDIA Share Price Analysis: Market Consolidation Ahead of a Potential Bullish Rally
$187.22
30 Dec 2025, 23:28

S&P 500 - Chart & Data from IG

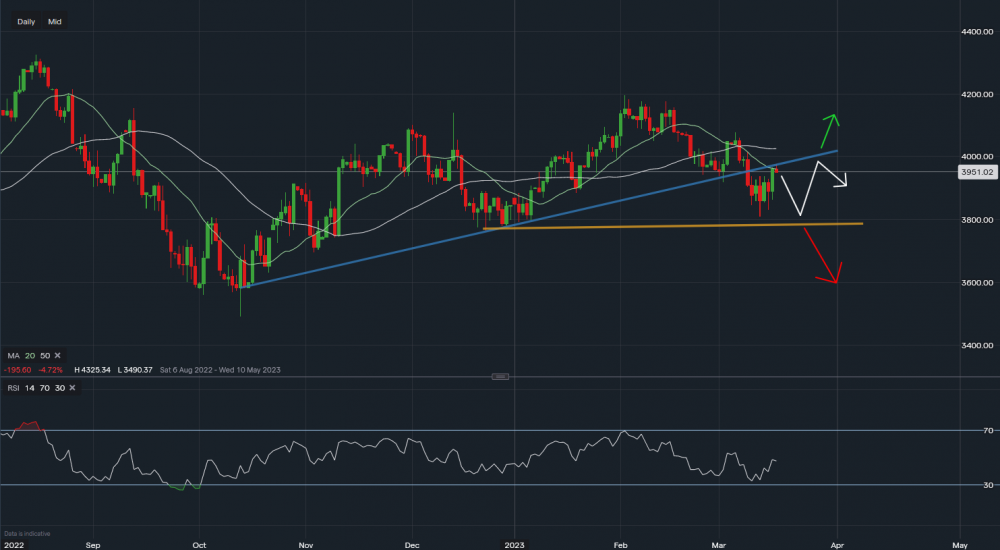
The S&P continues to be noisy at its current levels. Tough resistance sits at 3,960 where the original upside trendline & 20SMA sit on the daily timeframe. If the S&P can close above this on the daily timeframe, then a move higher towards 4,020 seems possible. Currently, the market is rejecting this zone and therefore another drop lower before long seems possible. The base of the recent move lower needs to be confirmed. A break below here though and the index can fall towards 3,500. Right now the index is neutral.