General Dynamics (GD) Fundamental and Technical Stock Analysis: Can the Defence Prime Keep Outperforming?
$364.70
04 Mar 2026, 12:54
Neutral

Join Minipip Academy and access free courses in investing, trading, economics, and more.
Sign Up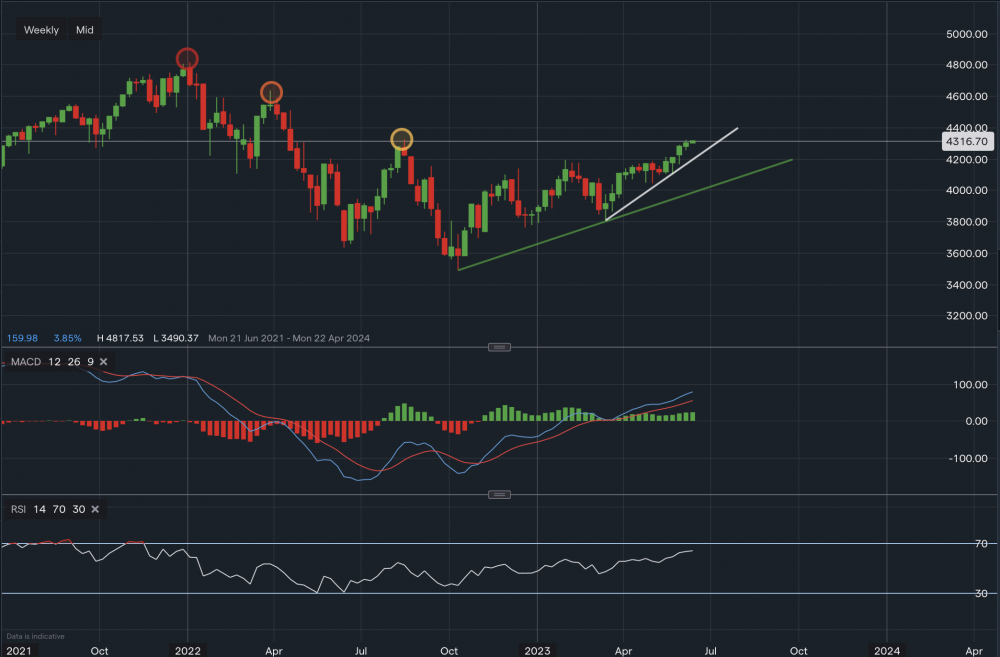
Chart & Data from IG
The S&P 500 is now up over 11% since the start of 2023, after falling around 27% in 2022. The index has had a pretty strong comeback regardless of all the pessimism surrounding the conditions of the markets. Particularly the US markets. A big driver, as many already know, has been the rapid recovery of the tech stocks. Looking on the weekly timeframe, the index is currently trading at around 4,316. We can see that the support is well established below along the trendlines, with the first key support sitting at 4,260 (along the white trendline). A break below this trendline could see a further retracement towards the next key support of 4,102 (along the green trendline). However, the bias remains bullish, and we can see that the index is approaching its next resistance level sitting at 4,325 (yellow oval). A break and close above this resistance level would then allow us to look towards further resistance points, with the next at 4,637 (orange oval) followed by the all-time high of 4,817 (red oval). Although, this is more likely in the longer-term. Looking at the technical indicators, both of the indicators remain positive with the RSI reading 64. This week is huge for the markets and investors as the Federal Reserve will announce whether its hiking interest rate spree is coming to a halt. This decision will certainly have an effect on the markets and investor sentiment. In theory, a halt could have a positive impact, whereas a continuation could have a negative impact. Markets have already priced in a pause based on past comments and recent economic data.

Tradable assets:
Min.Deposit:
Max Leverage:
FCA:

Rating:


 Earnings Calendar
  Economic Calendar
  VAT Calculator
  Tax Free Childcare Calculator
 Percentage Calculator
 Compound Interest Calculator
  Loan Overpayment Calculator
 Mortgage Calculator
 Credit Card Calculator
 Investing
  Economics
 Trading
  Technical Analysis
  Personal Finance
 Calculator


