General Dynamics (GD) Fundamental and Technical Stock Analysis: Can the Defence Prime Keep Outperforming?
$364.70
04 Mar 2026, 12:54
Neutral

Join Minipip Academy and access free courses in investing, trading, economics, and more.
Sign Up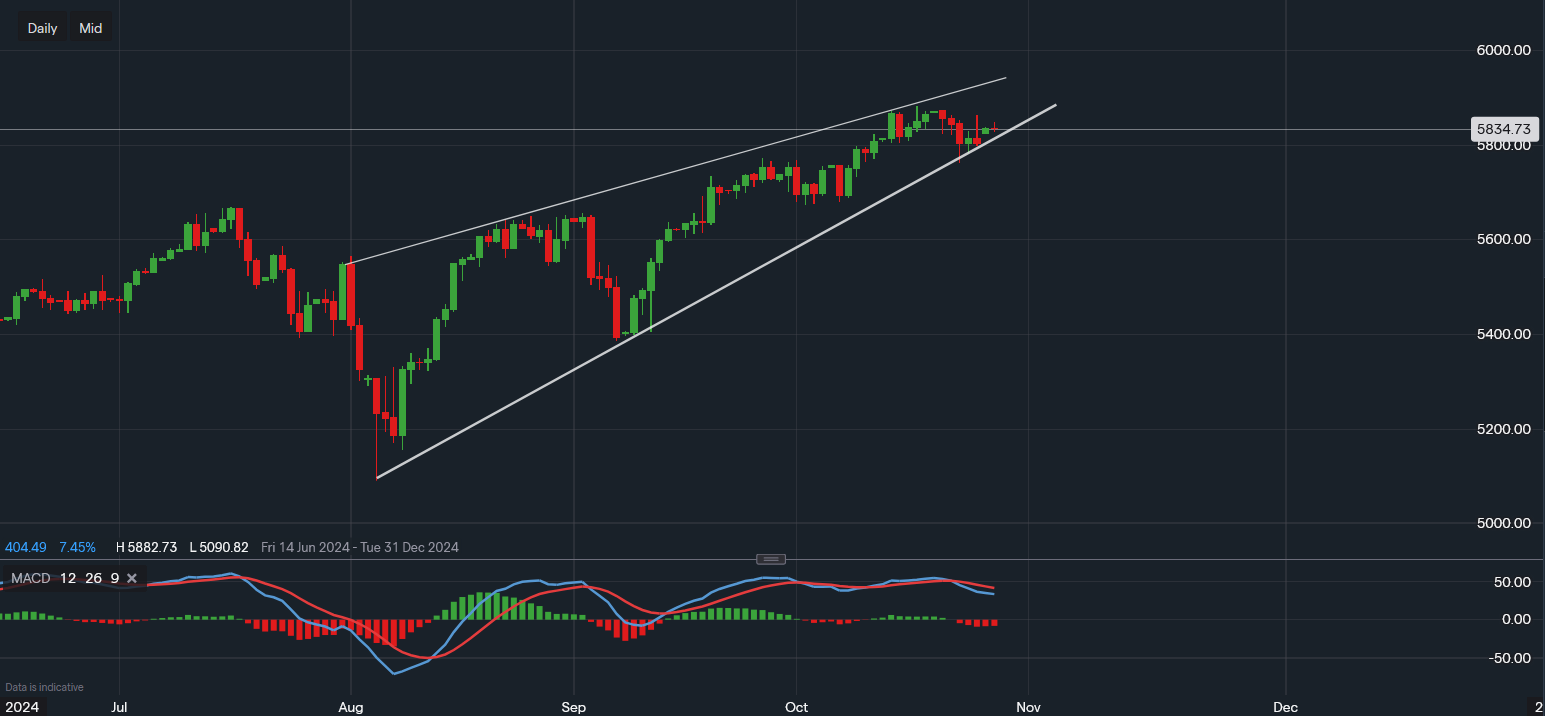
Chart & Data from IG
S&P 500 Analysis: Key Support and Resistance Levels Amid Earnings Week
This week, investors will be watching the S&P 500 closely around the lower rising trendline support within its current channel, a critical level for potential market moves. Following the first red week since early September, the S&P 500 found support around 5,762 and has since inched higher, now trading around 5,834, with a 0.4% increase on the day. With major earnings announcements, including Alphabet’s report tomorrow, markets are bracing for potential impacts on the index.
Critical Levels to Watch: Support and Resistance
Trendline support currently lies near 5,809. A drop below this level could shift the focus back to 5,762 for a possible retest. If the index breaks below 5,762, it could trigger panic selling, pushing traders to look at the 5,670-5,700 range for additional support in the short term.
On the upside, the S&P 500 faces resistance at 5,864, a level tested last Friday before closing lower by -0.14%. A breakout above 5,864 may bring renewed buying interest, potentially leading to a retest of the all-time high of 5,882.
Market Momentum and MACD Indicator
The MACD indicator recently turned bearish, suggesting fading momentum and possible profit-taking as investors proceed with caution. With increased volatility likely until after the election, MACD is expected to remain flat, signaling sideways movement amid broader market uncertainty.

Tradable assets:
Min.Deposit:
Max Leverage:
FCA:

Rating:


 Earnings Calendar
  Economic Calendar
  VAT Calculator
  Tax Free Childcare Calculator
 Percentage Calculator
 Compound Interest Calculator
  Loan Overpayment Calculator
 Mortgage Calculator
 Credit Card Calculator
 Investing
  Economics
 Trading
  Technical Analysis
  Personal Finance
 Calculator


