General Dynamics (GD) Fundamental and Technical Stock Analysis: Can the Defence Prime Keep Outperforming?
$364.70
04 Mar 2026, 12:54
Neutral

Join Minipip Academy and access free courses in investing, trading, economics, and more.
Sign Up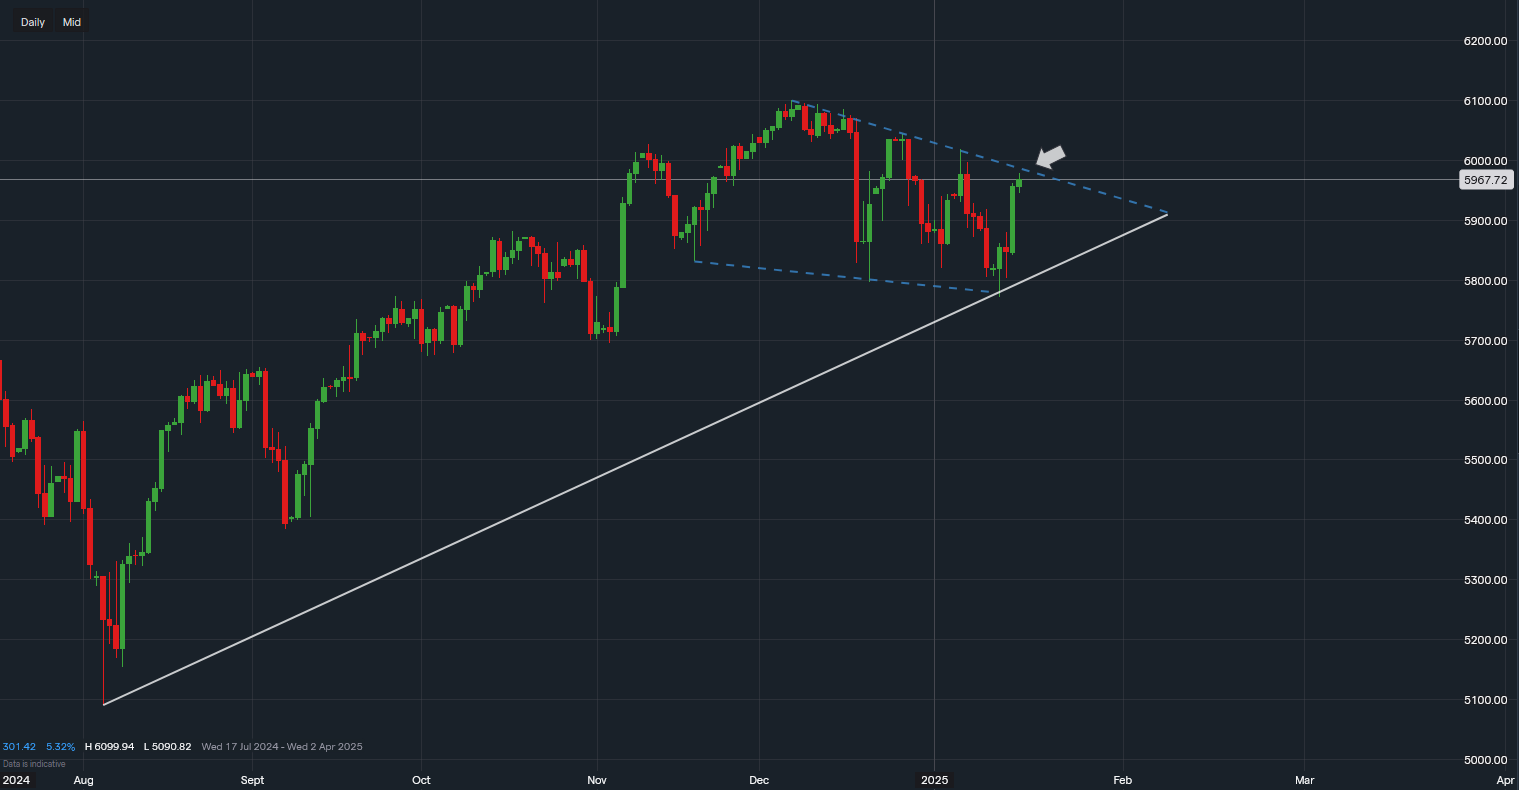
Chart & Data from IG
The S&P 500 has surged back to trendline resistance following a notable 1.8% rise in yesterday’s session, driven by optimism around cooling US inflation data. As of today, the index is trading near 5,967, with trendline resistance situated between 5,985 and 5,990 for the intraday session.
A break above 5,990 will not immediately confirm a breakout, as the index faces additional resistance at 6,018. Securing the pivotal 6,000-point level could provide room for consolidation, boosting investor and trader confidence that the index may continue to climb.
With Donald Trump’s inauguration day on January 20th (next Monday), markets could experience heightened volatility in the lead-up to this significant political event. Any uncertainty may create short-term price fluctuations.
If resistance at 5,985-5,990 proves too strong, the S&P 500 may pull back towards trendline support at 5,830-5,840. A failure to hold this support could lead to a deeper correction, potentially retesting the recent low of 5,771.
For traders, the levels of 5,985 and 6,018 will be critical to monitor, as they could signal a broader breakout or a reversal. Investors should remain cautious in the short term while keeping an eye on potential support zones at 5,830 and 5,771.
The S&P 500’s price action this week is likely to set the tone for the coming weeks, especially with political and economic events shaping sentiment. Stay updated on the latest developments to make informed decisions.

Tradable assets:
Min.Deposit:
Max Leverage:
FCA:

Rating:


 Earnings Calendar
  Economic Calendar
  VAT Calculator
  Tax Free Childcare Calculator
 Percentage Calculator
 Compound Interest Calculator
  Loan Overpayment Calculator
 Mortgage Calculator
 Credit Card Calculator
 Investing
  Economics
 Trading
  Technical Analysis
  Personal Finance
 Calculator


