General Dynamics (GD) Fundamental and Technical Stock Analysis: Can the Defence Prime Keep Outperforming?
$364.70
04 Mar 2026, 12:54
Neutral

Join Minipip Academy and access free courses in investing, trading, economics, and more.
Sign Up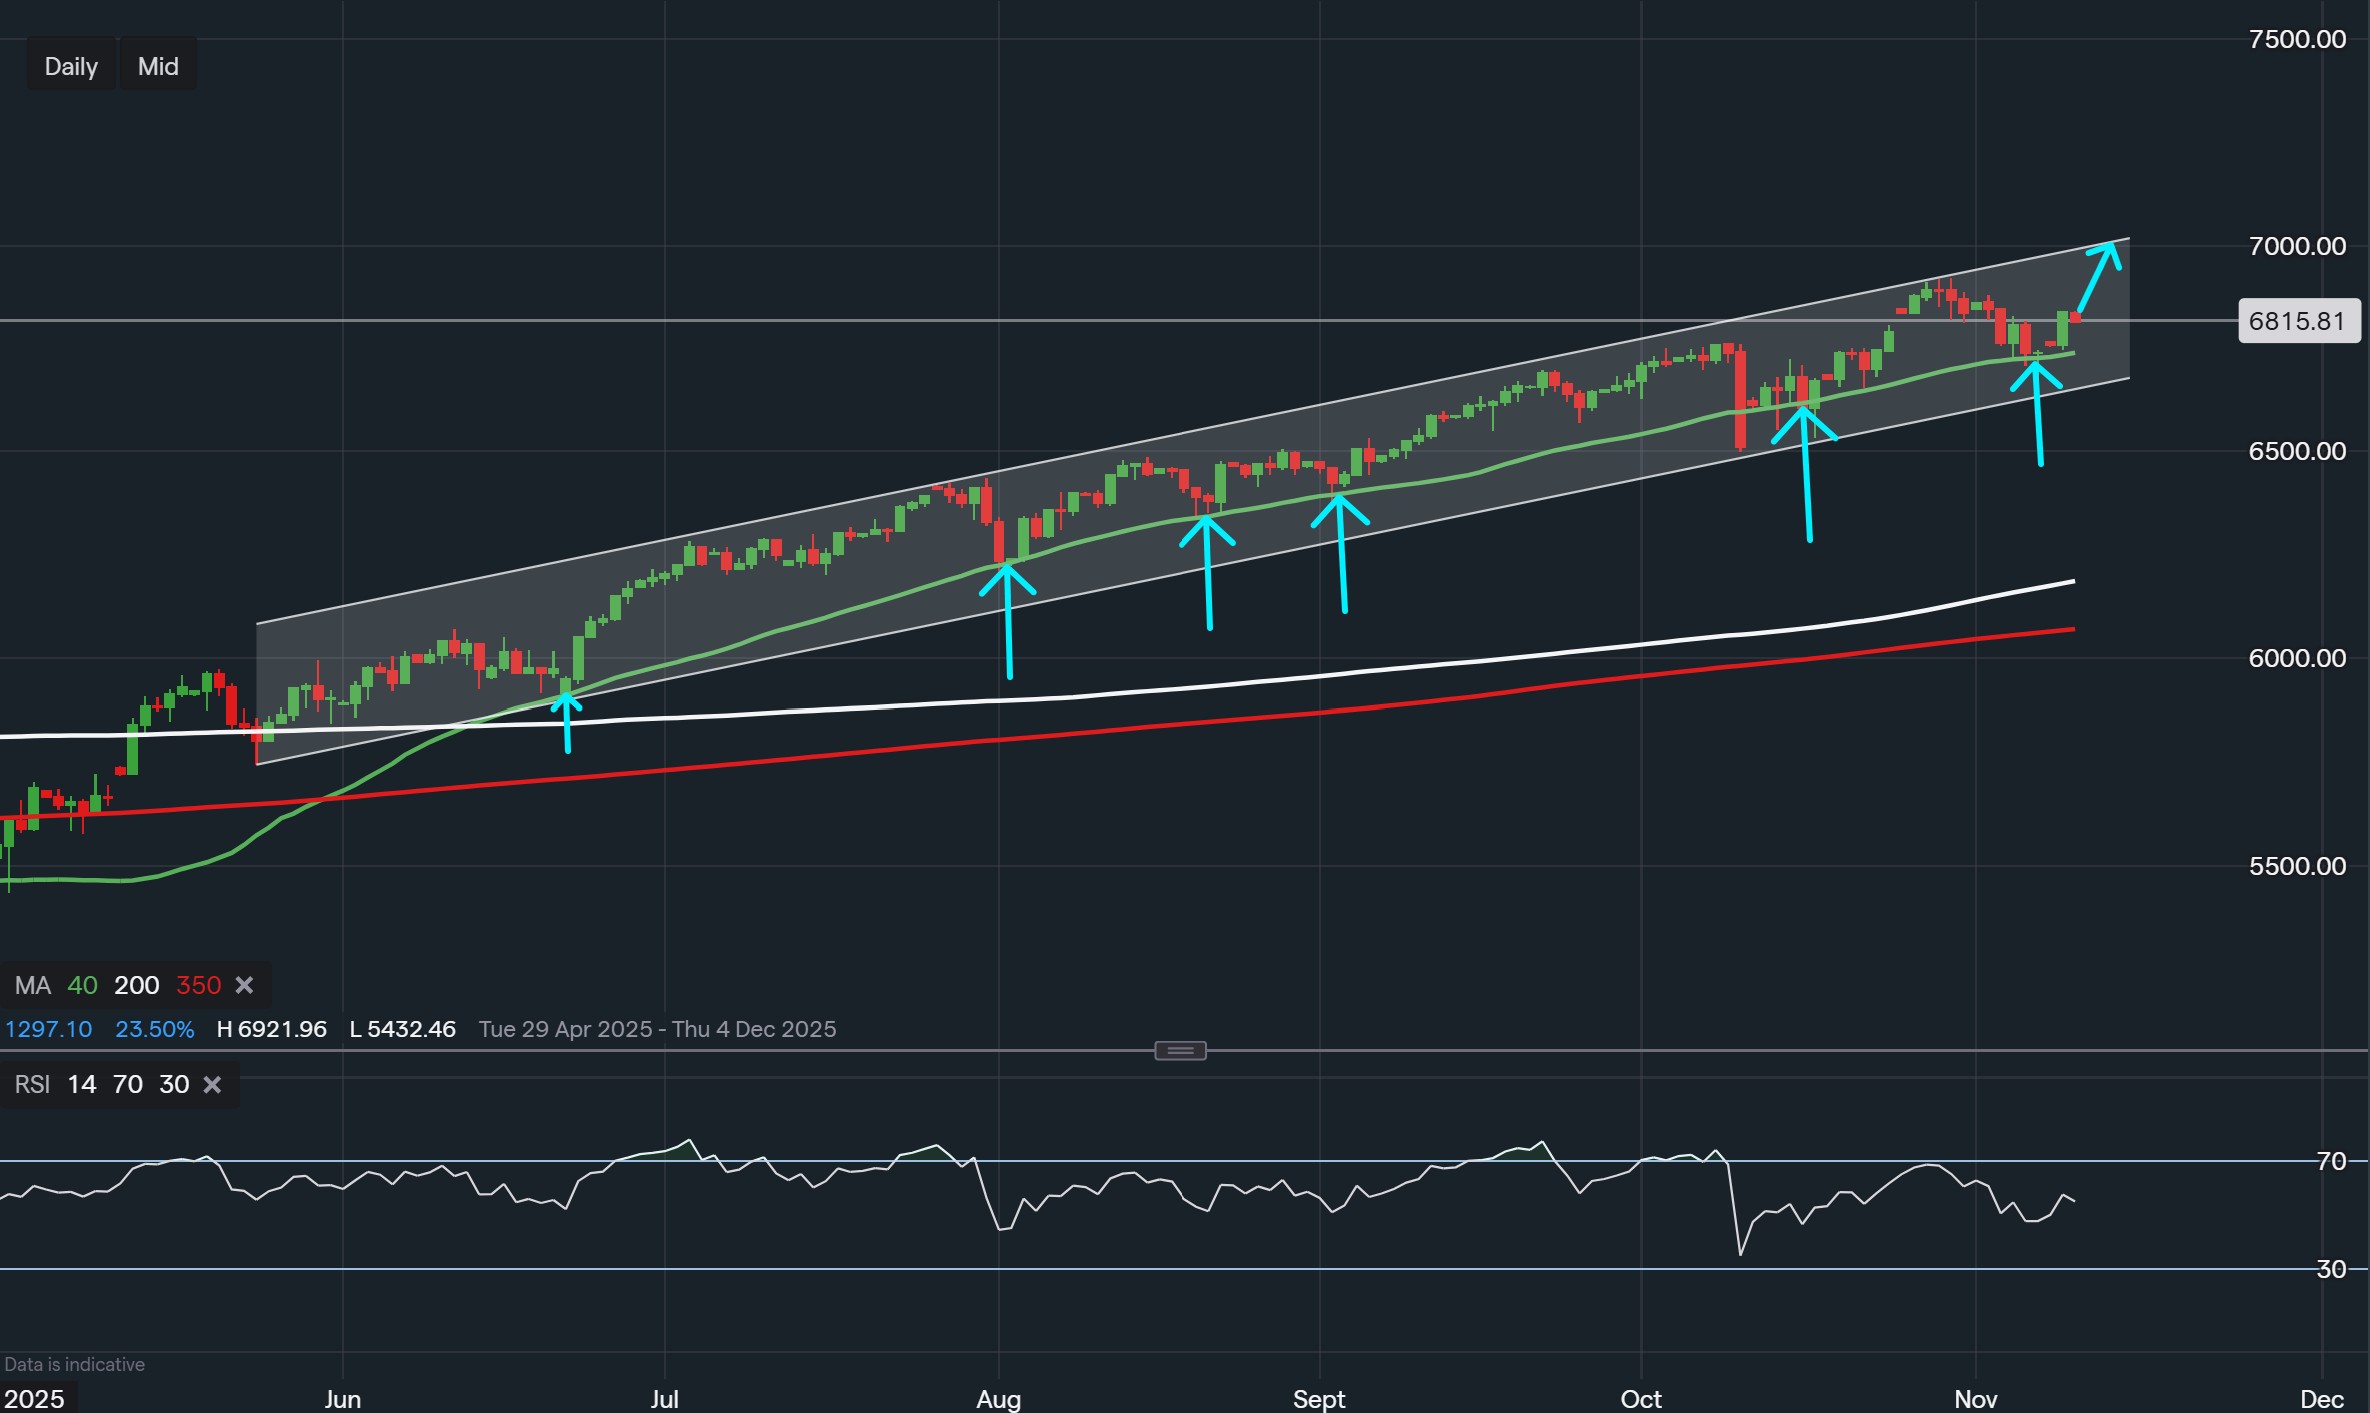
Data from IG - Timeframe - Daily
Market Overview
The S&P 500 continues to demonstrate a resilient upward trend on the daily timeframe, maintaining a clearly defined ascending channel. Price action has shown consistent respect for the 40-day moving average (MA), repeatedly rebounding from this dynamic support and creating higher highs with each successive pullback.
This behaviour reflects strong market participation on dips, indicating that buyers remain active within the structure. The most recent reaction from the 40 MA once again sparked a rebound, suggesting that price may be preparing for another move toward the upper boundary of the channel.
The Relative Strength Index (RSI) remains comfortably balanced below overbought levels, supporting the potential for continued upside momentum. The combination of trend consistency and moderate momentum leaves room for further appreciation if buying interest persists.

Data From IG - Timeframe - 4H
4-Hour Chart: Technical Structure and Price Action
The shorter-term structure reinforces the daily bullish bias. Price has repeatedly respected the 38.2% and 61.8% Fibonacci retracement levels, each acting as reliable zones of support during consolidations. Within this range, a fair-value gap formed near the 50% retracement zone, highlighting a liquidity imbalance that could attract price once again potentially offering a re-entry or continuation zone for bullish activity.
Moving Averages
Momentum alignment remains strong across the 4-hour chart, with the 40-period MA positioned above the 200 and 350 MAs, confirming an intact bullish sequence.
Recent price action also shows a rebound from the 350 MA, which serves as a key long-term support. This rebound reinforces the index’s underlying strength and indicates that the broader uptrend remains healthy despite occasional corrections.
RSI Momentum
The RSI indicator has recovered strongly after briefly touching oversold territory — a classic sign of bullish divergence. It now rests around neutral levels, providing further room for upward extension without signalling exhaustion. This suggests that momentum remains constructive and could fuel additional gains if market conditions remain supportive.
Price Value Gap (October 26)
Price has re-entered a previously unfilled value gap from 26 October. Historically, such re-entries can precede decisive continuation moves. If volume increases and macro conditions remain favourable, this area could act as a launchpad for renewed upside momentum, aligning with the broader bullish narrative.
Government Shutdown and Market Sentiment
Despite uncertainty linked to the US government shutdown, the market has shown notable resilience, with the index gaining +1.54% in today’s session. Optimism appears to stem from progress towards a resolution, which has temporarily boosted sentiment across risk assets.
While uncertainty remains, the current positive momentum suggests that investors are cautiously positioning for stability. Should macro clarity continue to improve, it may provide a supportive backdrop for further technical strength and reinforce the ongoing uptrend.
Potential Outlook
The broader picture continues to favour bullish continuation across both timeframes. Support remains clearly defined around the 40-day MA on the daily chart and the 350-period MA on the 4-hour chart , both acting as reliable zones where buyers have previously re-emerged.
The 50% Fibonacci fair-value gap is a key technical area of interest, offering a potential opportunity for renewed bullish momentum if price revisits and holds this zone. To the upside, resistance sits near the upper boundary of the daily channel, positioned around recent highs, which could serve as the next upside objective.
Market participants may find opportunity in observing how the index behaves around the October 26 gap and the mid-range Fibonacci area, as these levels could determine the timing and strength of any upcoming breakout attempt. Macro developments, particularly those surrounding fiscal negotiations, should also be monitored closely, as they have the potential to either reinforce or temporarily temper the prevailing technical bias.
Conclusion
The S&P 500 presents a technically strong structure with upward momentum supported by rising moving averages, Fibonacci confluence, and constructive RSI positioning. Both the daily and 4-hour charts highlight a continuation pattern that reflects growing confidence in the broader trend.
While short-term volatility may arise from macro headlines, the underlying technical foundation continues to suggest a potential opportunity for further upside if momentum remains aligned with the established channel.
Disclaimer
This analysis is intended solely for educational and informational purposes. It does not constitute financial advice, investment guidance, or trading recommendations. Market conditions can change rapidly, and all investment decisions should be made based on individual research.

Tradable assets:
Min.Deposit:
Max Leverage:
FCA:

Rating:


 Earnings Calendar
  Economic Calendar
  VAT Calculator
  Tax Free Childcare Calculator
 Percentage Calculator
 Compound Interest Calculator
  Loan Overpayment Calculator
 Mortgage Calculator
 Credit Card Calculator
 Investing
  Economics
 Trading
  Technical Analysis
  Personal Finance
 Calculator


