General Dynamics (GD) Fundamental and Technical Stock Analysis: Can the Defence Prime Keep Outperforming?
$364.70
04 Mar 2026, 12:54
Neutral

Join Minipip Academy and access free courses in investing, trading, economics, and more.
Sign Up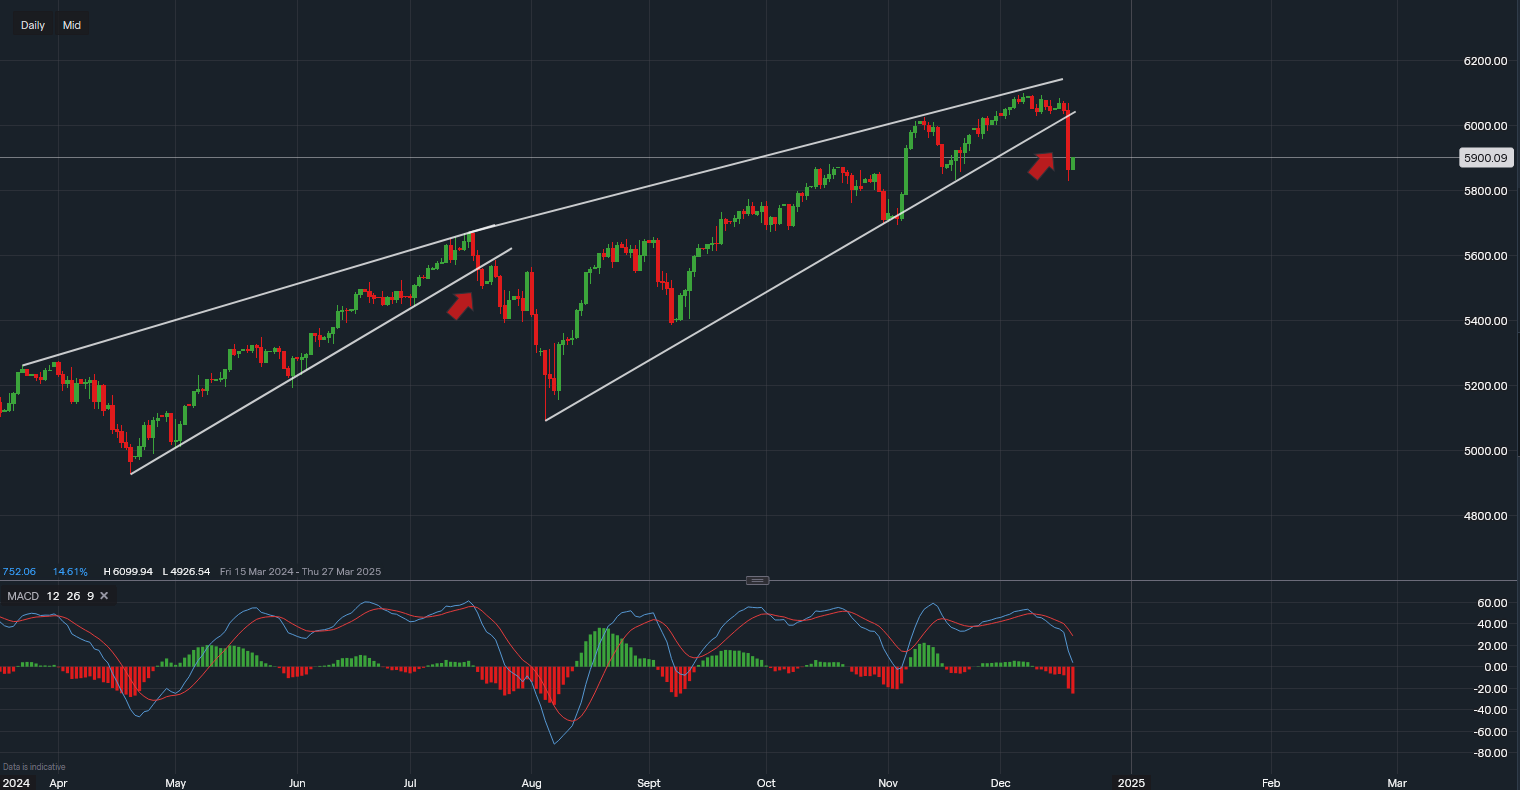
Chart & Data from IG
The S&P 500 index has recently broken out of a key wedge pattern, but this time to the downside. This marks the first such occurrence since July, when the index experienced a further decline of 7% before stabilising. From its August low, the index had gained an impressive 18%—a rally that was interrupted by yesterday’s FOMC meeting, where the Federal Reserve announced a 25 basis point interest rate cut.
Despite the rate cut, Federal Reserve Chair Jerome Powell signalled a slower pace for future rate cuts heading into 2025. The central bank’s cautious approach aims to tackle inflation without reversing the progress made so far. This announcement injected uncertainty into the market, prompting profit-taking and portfolio adjustments.
Currently, the S&P 500 index is trading around 5,894, having broken below the lower trendline of the wedge pattern. The index has found temporary support near 5,830 as buyers stepped in. However, a sustained break below this level could lead to a deeper sell-off, potentially retesting the 5,660–5,700 zone. This area has historical significance, acting as a critical support level during the period surrounding the US election. Such a move would equate to a decline of approximately 3.5% to 4% from current levels.
For the market to regain bullish momentum and mitigate the risk of a broader correction, the index would need to consolidate above the psychologically important 6,000 mark. Until then, downside risks remain elevated, with profit-taking and portfolio rebalancing likely to weigh on the index.
A look at the MACD indicators shows a sharp decline. While the indicator has not yet reached oversold territory, historical trends suggest there is room for further downside. This reinforces the possibility of additional selling pressure in the near term.
With the S&P 500 breaking below a significant technical pattern and facing macroeconomic uncertainties, traders and investors should monitor key support levels closely. A break below 5,830 could open the door to further declines, while a move above 6,000 would signal renewed strength. Until then, volatility and downside risks are likely to dominate the market narrative.

Tradable assets:
Min.Deposit:
Max Leverage:
FCA:

Rating:


 Earnings Calendar
  Economic Calendar
  VAT Calculator
  Tax Free Childcare Calculator
 Percentage Calculator
 Compound Interest Calculator
  Loan Overpayment Calculator
 Mortgage Calculator
 Credit Card Calculator
 Investing
  Economics
 Trading
  Technical Analysis
  Personal Finance
 Calculator


