General Dynamics (GD) Fundamental and Technical Stock Analysis: Can the Defence Prime Keep Outperforming?
$364.70
04 Mar 2026, 12:54
Neutral

Join Minipip Academy and access free courses in investing, trading, economics, and more.
Sign Up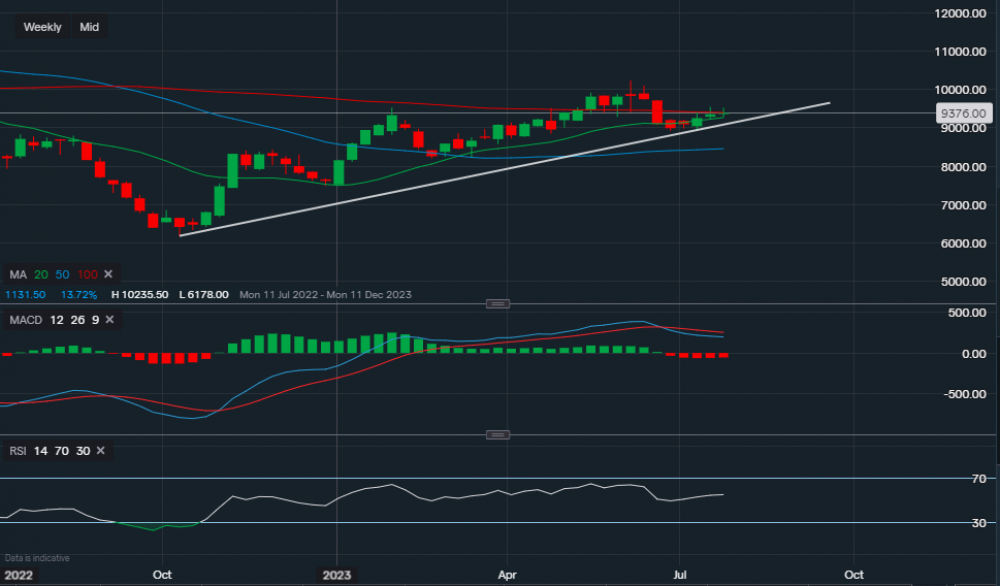
Chart & Data from IG
Sony is currently trading at around $93.76 a share. The tech company is due to report earnings on Monday with the analysts forecasting an EPS of $1.02 on revenue of $17,63bn. Taking a looking at the chart from a technical perspective, we can see that support is well established along the trendline on the weekly timeframe. The price continues with higher highs and higher lows, we saw a slight retracement in June as we had some profit-taking due to a new high within this bullish trend ($102.35). The price climbed above the 100-day moving average (red), then pulled back towards the trendline (retracement – profit taking). Week commencing July 10th there was a bounce back of the trendline and the price is now approaching the 100-day MA once more. A break and close above it could see the price continue higher towards the high of $102.35. Towards the downside, first support level sits at $92.60 (20-day MA) then along the trendline at $91.71. A move below the trendline could see the price slide lower, although there will be support along the 50-day MA. Which currently reads $84.54. The technical indicators are mixed, MACD is slightly negative but the RSI is just positive as it reads 55.


 Earnings Calendar
  Economic Calendar
  VAT Calculator
  Tax Free Childcare Calculator
 Percentage Calculator
 Compound Interest Calculator
  Loan Overpayment Calculator
 Mortgage Calculator
 Credit Card Calculator
 Investing
  Economics
 Trading
  Technical Analysis
  Personal Finance
 Calculator


