AbbVie (ABBV) Stock Analysis: Humira Decline, New Drug Growth, and Technical Consolidation
$228.47
06 Mar 2026, 17:58
Neutral

Join Minipip Academy and access free courses in investing, trading, economics, and more.
Sign Up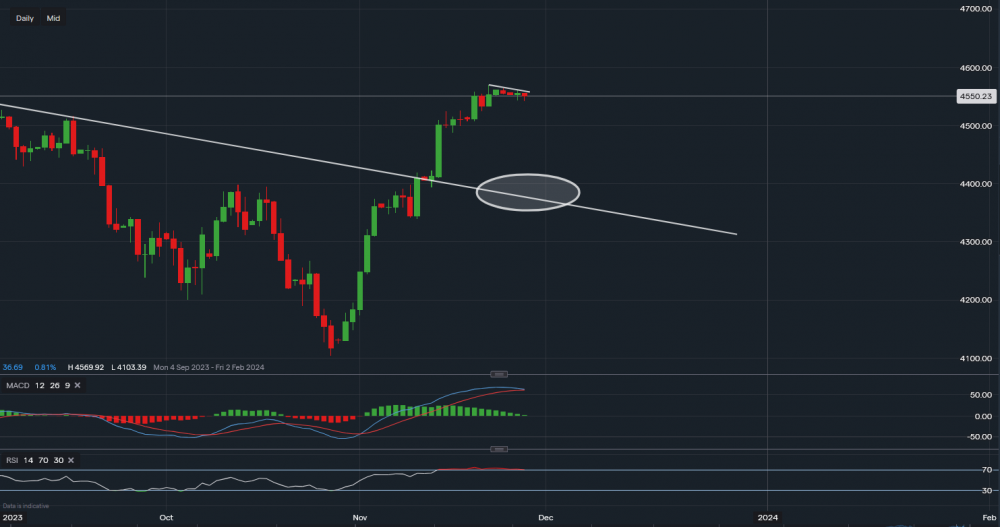
Chart & Data from IG
The SP500 seems like it may be undergoing a break from the recent rally ahead of some economic data due this week. Currently, the index is trading at around 4,550. A small resistance is highlighted by the mini trendline line shown on the chart, the key level here now is 4,569. A break above this level may see an extension higher towards 4,600. The point of support reads 4,541, which is also the low of today’s session as of now. A break and close below this point may see the index grind lower towards 4,524 then 4,499 and maybe even test 4,487. If we head to the technical indicators at the bottom of the chart, we can see that the MACD’s volume has now almost lowered entirely and the MACD line is almost touching the signal line. Suggesting neutral conditions. The RSI in theory is positive but has now indicated overbought conditions since the 14th of November, currently reading 69.76.

Tradable assets:
Min.Deposit:
Max Leverage:
FCA:

Rating:


 Earnings Calendar
  Economic Calendar
  VAT Calculator
  Tax Free Childcare Calculator
 Percentage Calculator
 Compound Interest Calculator
  Loan Overpayment Calculator
 Mortgage Calculator
 Credit Card Calculator
 Investing
  Economics
 Trading
  Technical Analysis
  Personal Finance
 Calculator


