AbbVie (ABBV) Stock Analysis: Humira Decline, New Drug Growth, and Technical Consolidation
$228.47
06 Mar 2026, 17:58
Neutral

Join Minipip Academy and access free courses in investing, trading, economics, and more.
Sign Up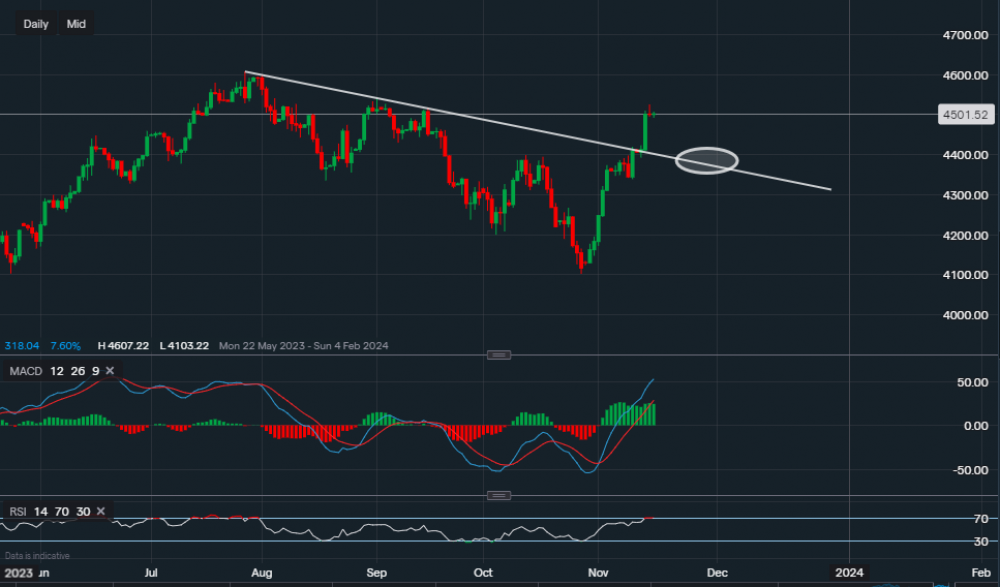
Chart & Data from IG
Taking a look at the SP500 as it is now clear that the breakout has happened and the longer-term bullish trend is now more likely to resume. Currently, the index is trading at around 4,501 and we can see that it tried to continue higher yesterday but ran out of steam. The index reached a high of 4,524 but it retraced back to 4,500 after the retail data. The next key resistance here for the S&P is 4,540, a break and close above it would suggest that we then may see a move towards the high of the year (4,607). However, as yesterday’s candlestick looks like a mix between a shooting star and a gravestone doji, along with the recent sharp rise and tough resistance above, we could as a result see a pullback towards the trendline due to some profit-taking. From a technical aspect, the pullback could fall as low as the area highlighted by the oval, testing the previous resistance trendline which is now acting as support. After the correction, the index should continue higher on optimism regarding the cutting of interest rates by the Fed but also globally. Trendline support ranges between 4,360-4380. A break below this level may even see the index test 4,338. Looking at the technical indicators, they remain highly positive. The MACD volume is still enlarged and the RSI now reads 70. However, the RSI is now suggesting overbought conditions. Looking at the past months during 2023, when a similar level has been reached on the daily timeframe, in the following days the index has taken a breather.

Tradable assets:
Min.Deposit:
Max Leverage:
FCA:

Rating:


 Earnings Calendar
  Economic Calendar
  VAT Calculator
  Tax Free Childcare Calculator
 Percentage Calculator
 Compound Interest Calculator
  Loan Overpayment Calculator
 Mortgage Calculator
 Credit Card Calculator
 Investing
  Economics
 Trading
  Technical Analysis
  Personal Finance
 Calculator


