General Dynamics (GD) Fundamental and Technical Stock Analysis: Can the Defence Prime Keep Outperforming?
$364.70
04 Mar 2026, 12:54
Neutral

Join Minipip Academy and access free courses in investing, trading, economics, and more.
Sign Up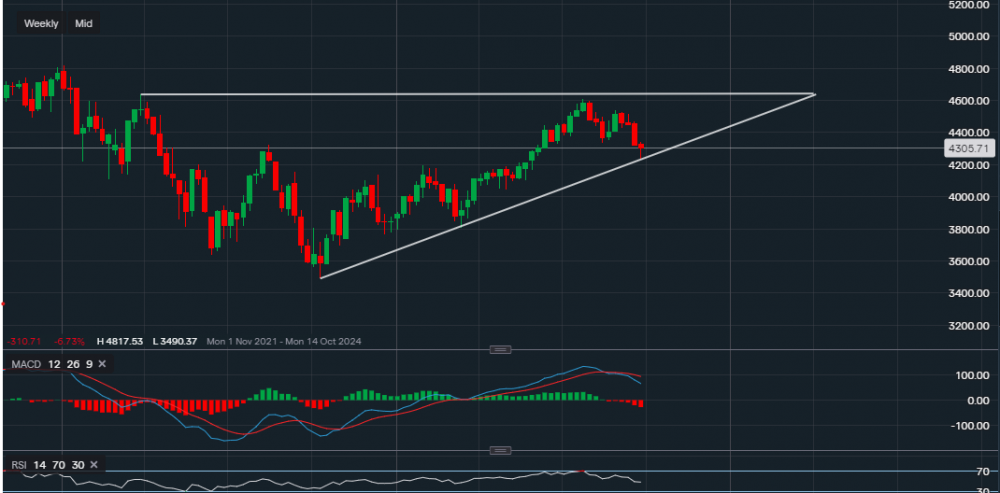
Chart & Data from IG
Taking a look at the SP500 as the index almost tested the supportive trendline of the triangle (4,192), but so far the lowest point this week has been 4,238. Currently, the SP500 is trading at around 4,305, the value of the index is now based in a support-resistance zone. The resistance in this area is 4,325 (level created in the week commencing August 15th) with the support of 4,238 (low point of this week). A break below 4,238 may see the index test the key support level along the trendline. A move back above 4,325 could lead to some consolidation. Until then, it will be difficult to gauge the near-term direction of the SP500 and the market sentiment. However, for the time being, bears are in control. If we look over at the technical indicators, the MACD remains pretty negative but the RSI is neutral as it reads 47.

Tradable assets:
Min.Deposit:
Max Leverage:
FCA:

Rating:


 Earnings Calendar
  Economic Calendar
  VAT Calculator
  Tax Free Childcare Calculator
 Percentage Calculator
 Compound Interest Calculator
  Loan Overpayment Calculator
 Mortgage Calculator
 Credit Card Calculator
 Investing
  Economics
 Trading
  Technical Analysis
  Personal Finance
 Calculator


