General Dynamics (GD) Fundamental and Technical Stock Analysis: Can the Defence Prime Keep Outperforming?
$364.70
04 Mar 2026, 12:54
Neutral

Join Minipip Academy and access free courses in investing, trading, economics, and more.
Sign Up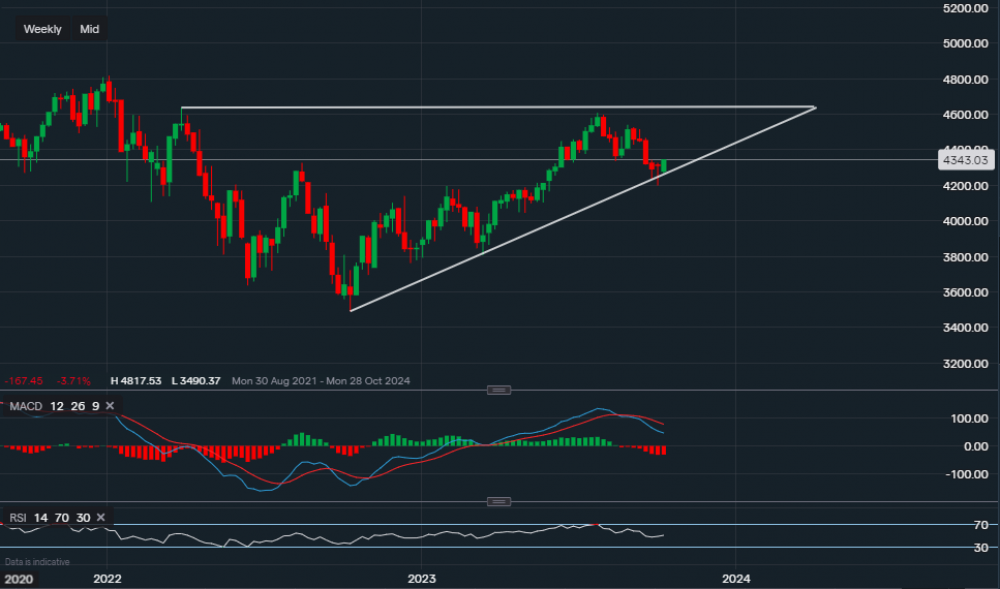
Chart & Data from IG
Taking a look at the SP500 as last week’s hammer candle has sparked optimism among investors ahead of the earnings season. Currently, the index is trading at around 4,343 with a strong start to the week so far. We can see that the support along the ascending trendline of the triangle is proving to be resilient so far, with the index technically falling below but then closing the week above it. Support now sits at 4,267, which is currently this week’s low. A break below it would see a move below the trendline, which in turn could lead to a test of last week’s low of 4,200. A move below 4,200 may suggest that this retracement since July is not yet over. On the other hand, we can now look at possible resistance levels. Resistance now sits at 4,422 then at 4,447. A break above 4,447 would then create the possibility of a move in the region of 4,480-4,500. If we look at the technical indicators, the outlook remains mixed. The MACD is still negative but the RSI is starting to flatten out and reads 51, the highest reading since the 18th of September.

Tradable assets:
Min.Deposit:
Max Leverage:
FCA:

Rating:


 Earnings Calendar
  Economic Calendar
  VAT Calculator
  Tax Free Childcare Calculator
 Percentage Calculator
 Compound Interest Calculator
  Loan Overpayment Calculator
 Mortgage Calculator
 Credit Card Calculator
 Investing
  Economics
 Trading
  Technical Analysis
  Personal Finance
 Calculator


