General Dynamics (GD) Fundamental and Technical Stock Analysis: Can the Defence Prime Keep Outperforming?
$364.70
04 Mar 2026, 12:54
Neutral

Join Minipip Academy and access free courses in investing, trading, economics, and more.
Sign Up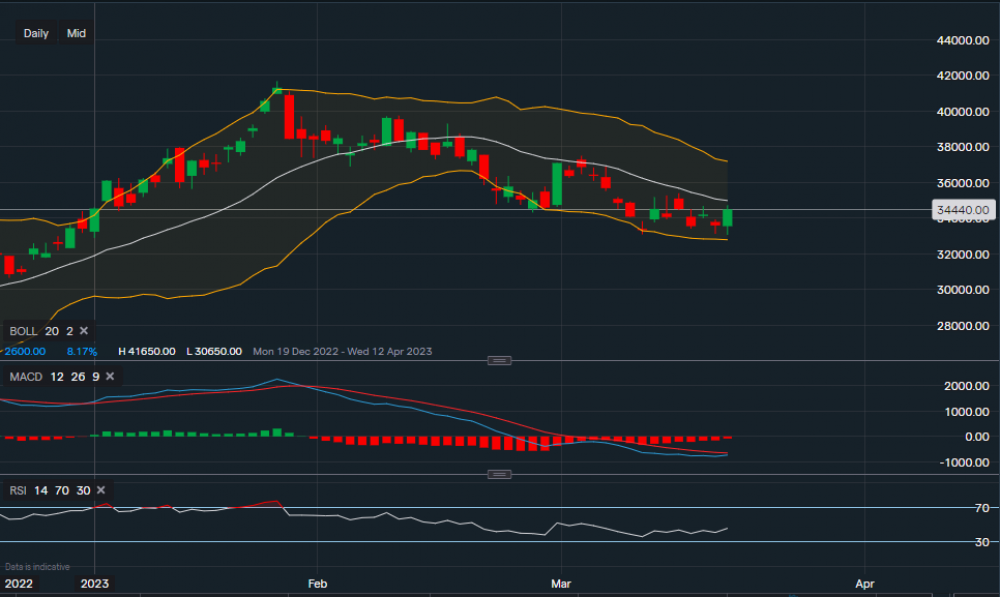
Chart & Data from IG
From a technical overview, Tencent’s share price is trading around $344.40 a share. We can see the retracement that began on the 26th of January as the RSI suggested the stock was overbought, profit taking also took place. The price of the stock now seems like It’s trying to consolidate itself and create a base, yesterday’s candle stick was overpowering and this could be a potential signal for some upside movement. Resistance sits at $349.66 (moving average of the Bollinger bands), followed by further resistance at $371.63 (upper Bollinger band). A break above $371.63 may see the price continue higher towards $390-$400. Although, this is more likely in the mid-term. Current support sits at $327.69 (lower Bollinger band), a break below could see the price slide towards $320-$310. This in turn would indicate that a reversal trend might be forming. Over to the technical indicators, the volume of the MACD seems to be fading and turning neutral and RSI is neutral as it reads 45


 Earnings Calendar
  Economic Calendar
  VAT Calculator
  Tax Free Childcare Calculator
 Percentage Calculator
 Compound Interest Calculator
  Loan Overpayment Calculator
 Mortgage Calculator
 Credit Card Calculator
 Investing
  Economics
 Trading
  Technical Analysis
  Personal Finance
 Calculator


