General Dynamics (GD) Fundamental and Technical Stock Analysis: Can the Defence Prime Keep Outperforming?
$364.70
04 Mar 2026, 12:54
Neutral

Join Minipip Academy and access free courses in investing, trading, economics, and more.
Sign Up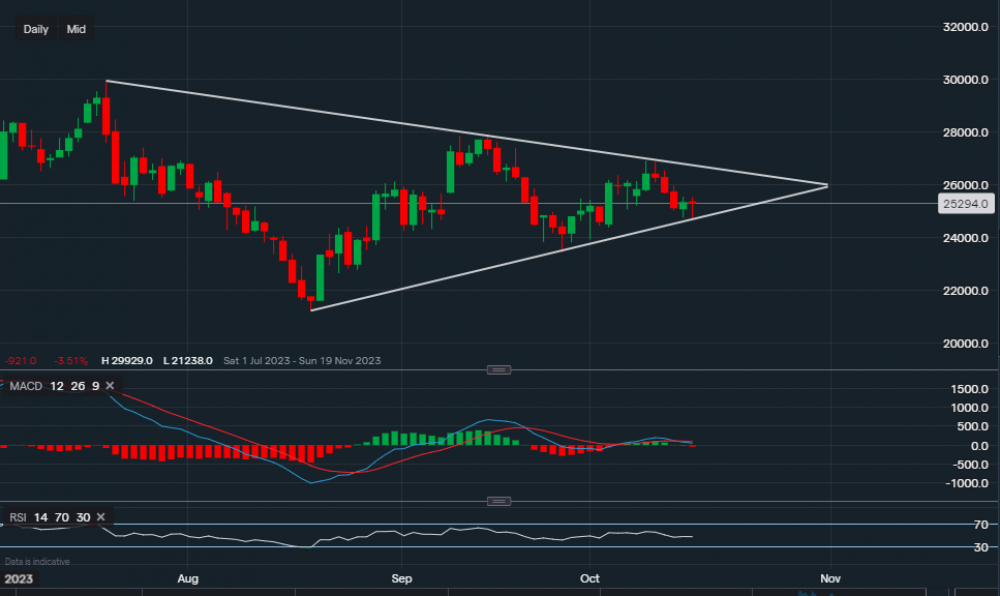
Chart & Data from IG
Taking a look at Tesla as the EV giant is due to report its quarterly earnings tomorrow after the US market closes. Currently, its shares are trading at around $252.94 a share, perhaps a little different now compared to the time of writing this post. We can see that Tesla’s stock has formed a symmetrical triangle on the daily interval, with the key support at $246.31 (lower trendline) and the key resistance at $265.86. A break below the support would first need to test the support of $234.59 before heading any lower. On the other hand, a break above the resistance level would then need to overcome $278.95 before heading any higher. These levels play a major role in the direction of Tesla’s price heading into the earnings season and back end of the year. The price initially fell at the open due to the hotter-than-expected retail sales data, as well as the conflict in the Middle East dampening the mood. But has now recovered a little. The earnings tomorrow may lead to or even test either the support or resistance. Looking at the technical indicators, they are a little mixed right now as seems to be the case for most stocks prior to key earnings ahead. The MACD is slightly negative but the RSI is neutral as it reads 48.

Tradable assets:
Min.Deposit:
Max Leverage:
FCA:

Rating:


 Earnings Calendar
  Economic Calendar
  VAT Calculator
  Tax Free Childcare Calculator
 Percentage Calculator
 Compound Interest Calculator
  Loan Overpayment Calculator
 Mortgage Calculator
 Credit Card Calculator
 Investing
  Economics
 Trading
  Technical Analysis
  Personal Finance
 Calculator


