AbbVie (ABBV) Stock Analysis: Humira Decline, New Drug Growth, and Technical Consolidation
$228.47
06 Mar 2026, 17:58
Neutral

Join Minipip Academy and access free courses in investing, trading, economics, and more.
Sign Up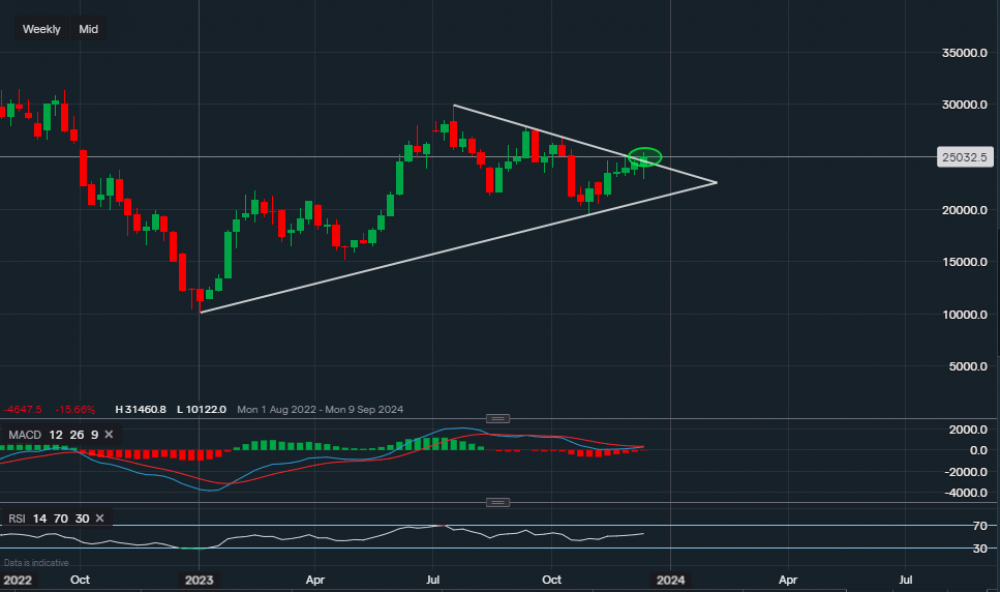
Chart & Data from IG
It seems like Tesla is making further progress with its possible breakout towards the upside. Currently, its shares are trading at around $250.32 a share, and we can see that the price has now edged above the trendline resistance of the triangle. The possible breakout is highlighted by the green oval on the chart, if a close above the trendline occurs then the next potential target for the bulls here would be $268.93. Followed by $278.92 and then $299.29. The support here is now the previous trendline resistance of $245.48, a move back into the triangle could then see a re-test of this week’s low ($228.20). The outlook remains rather neutral until any further confirmation, but it could be argued that the bias has now slightly shifted towards bullish. Unless there was a break below $228.20, which would then entice the bears to look towards the support of $211.80 (along the trendline). Looking at the technical indicators, they support the mentioned outlook. The MACD is still in theory negative but it looks like it will move above its signal line, potentially turning positive. The RSI has risen over recent weeks and is now positive as it reads 55.

Tradable assets:
Min.Deposit:
Max Leverage:
FCA:

Rating:


 Earnings Calendar
  Economic Calendar
  VAT Calculator
  Tax Free Childcare Calculator
 Percentage Calculator
 Compound Interest Calculator
  Loan Overpayment Calculator
 Mortgage Calculator
 Credit Card Calculator
 Investing
  Economics
 Trading
  Technical Analysis
  Personal Finance
 Calculator


