AbbVie (ABBV) Stock Analysis: Humira Decline, New Drug Growth, and Technical Consolidation
$228.47
06 Mar 2026, 17:58
Neutral

Join Minipip Academy and access free courses in investing, trading, economics, and more.
Sign Up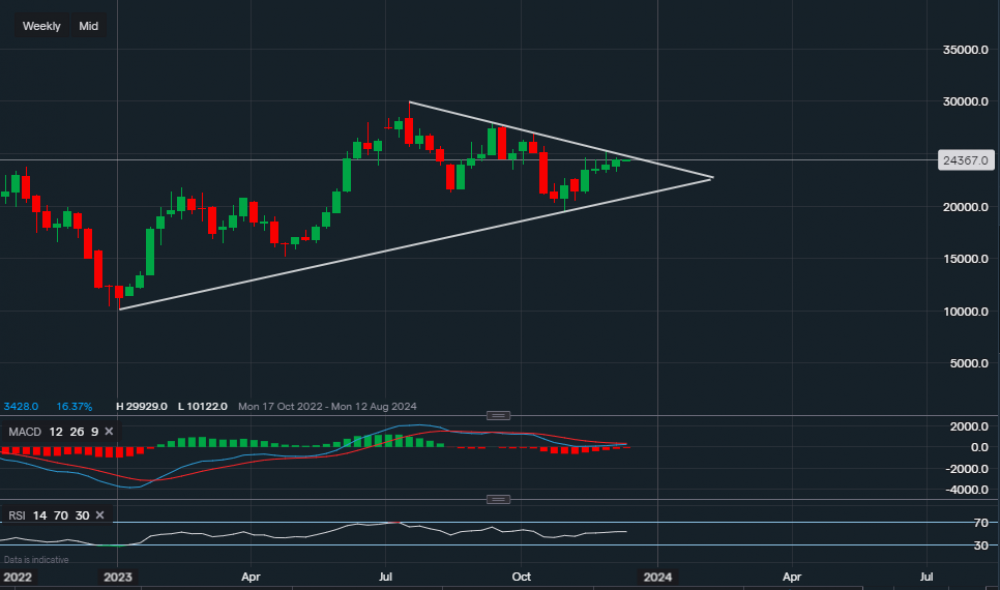
Chart & Data from IG
Taking a look at Tesla as its share price has now approached a key level here. Currently, its share price is trading at around $243.67 a share. We can see that the triangle pattern is still in place with no clear direction in either way, however, the price has approached the resistance side of the triangle. The resistance along the upper trendline reads $247.67, the weekly candlesticks have edged closer over the recent weeks and a break here could suggest further upside. Though a break would not be enough, a close above the trendline is required to increase the likelihood of bulls taking more of the control. A break and close above would then allow the bulls to target $252.73 and then $261.16. On the other hand, a rejection around this resistance area may see a move back towards the lower trendline for a re-test of the support. The first support reads $232.46. A break and close below could maybe lead to a slide even lower, with the next important support at $214.51 (along the lower trendline). The technical indicators are a little mixed, the MACD is slightly negative but volume has flattened out and it seems like it could turn neutral. Whereas the RSI is already neutral as it reads 53.


 Earnings Calendar
  Economic Calendar
  VAT Calculator
  Tax Free Childcare Calculator
 Percentage Calculator
 Compound Interest Calculator
  Loan Overpayment Calculator
 Mortgage Calculator
 Credit Card Calculator
 Investing
  Economics
 Trading
  Technical Analysis
  Personal Finance
 Calculator


