General Dynamics (GD) Fundamental and Technical Stock Analysis: Can the Defence Prime Keep Outperforming?
$364.70
04 Mar 2026, 12:54
Neutral

Join Minipip Academy and access free courses in investing, trading, economics, and more.
Sign Up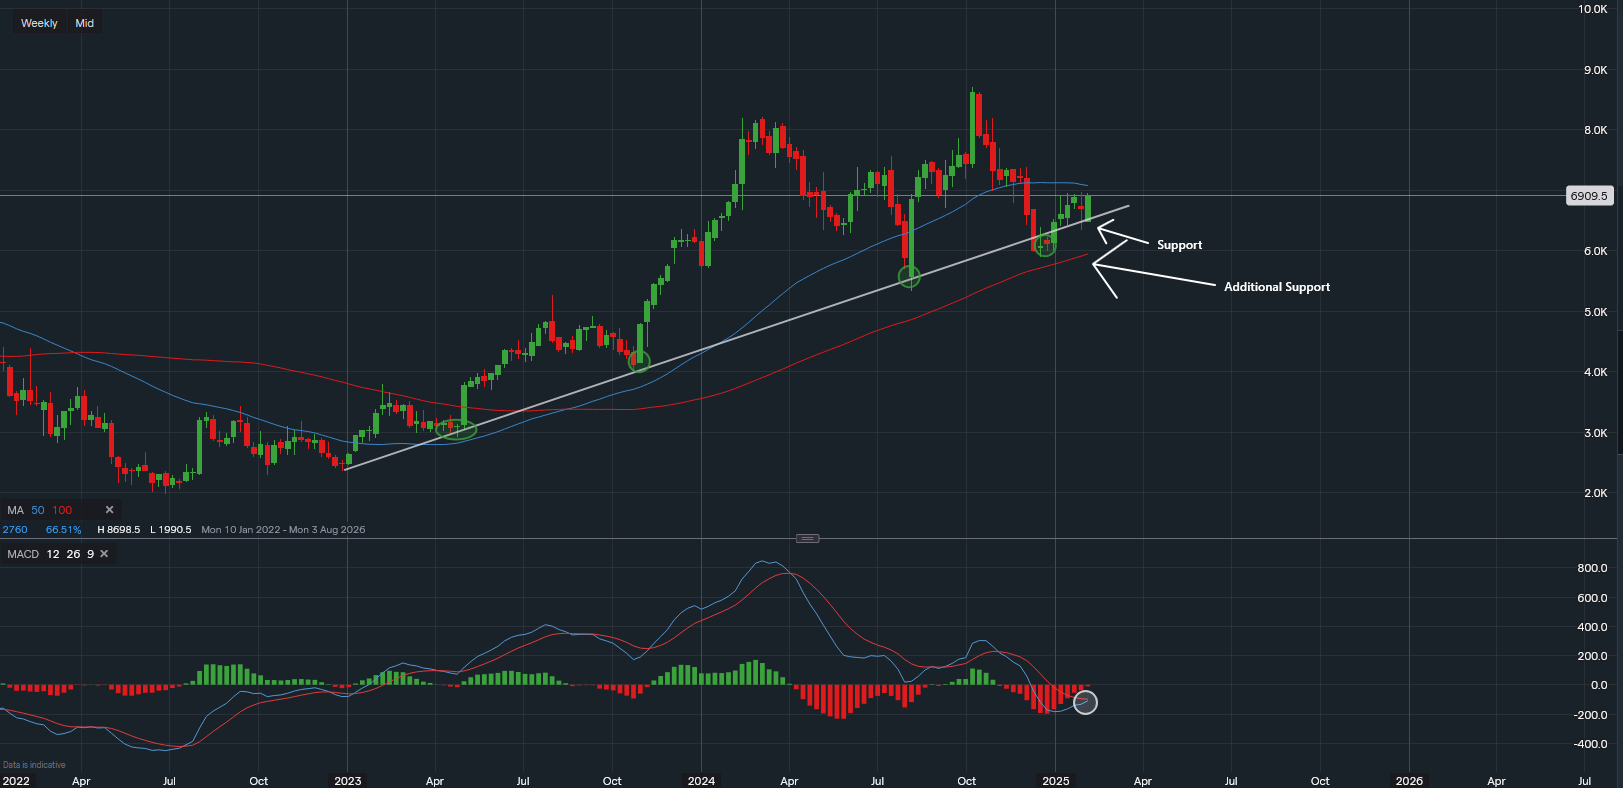
Chart & Data from IG
As Uber prepares to release its earnings report tomorrow, investors are closely monitoring key technical levels. Uber's stock is currently trading at $69.09 per share, up 2.5% at the time of writing. With earnings season in full swing, traders are watching price action for potential volatility and breakout opportunities.
Examining the weekly chart, a strong supportive trendline dating back to January 2023 has been a crucial level for Uber’s stock. This trendline has consistently provided support during the last four pullbacks, with share prices rebounding each time.
The most recent support test occurred in December 2023, when Uber’s stock managed to stay above this key level. However, despite this resilience, the price remains below the 50-day moving average (50MA), which could act as a short-term resistance level heading into tomorrow’s earnings announcement.
Looking at the MACD (Moving Average Convergence Divergence) indicator, the current setup remains technically bearish. However, the indicator is on the verge of turning bullish, suggesting a potential shift in momentum. While technicals provide valuable insight, fundamentals tend to drive short-term price movements—especially during earnings season.
With Uber’s stock trading at a critical technical juncture, traders and investors should stay cautious yet opportunistic as the earnings announcement approaches.

Tradable assets:
Min.Deposit:
Max Leverage:
FCA:

Rating:


 Earnings Calendar
  Economic Calendar
  VAT Calculator
  Tax Free Childcare Calculator
 Percentage Calculator
 Compound Interest Calculator
  Loan Overpayment Calculator
 Mortgage Calculator
 Credit Card Calculator
 Investing
  Economics
 Trading
  Technical Analysis
  Personal Finance
 Calculator


