General Dynamics (GD) Fundamental and Technical Stock Analysis: Can the Defence Prime Keep Outperforming?
$364.70
04 Mar 2026, 12:54
Neutral

Join Minipip Academy and access free courses in investing, trading, economics, and more.
Sign Up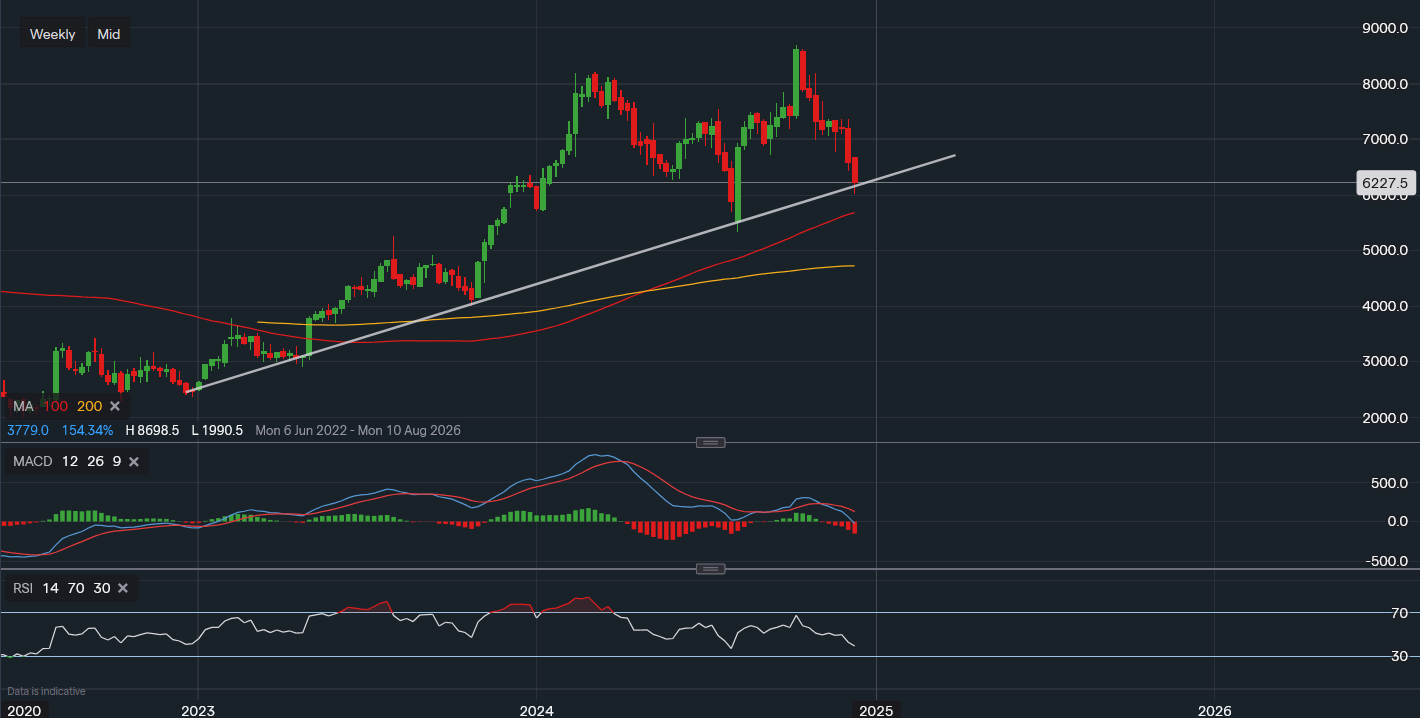
Chart & Data from IG
Uber has seen its stock price slide 27% from its yearly highs, now trading at approximately $62.77 per share. This decline has brought the stock to a critical technical support level that investors and traders are closely watching as the year comes to an end.
On the weekly chart, Uber’s price has reached a long-standing trendline that has been intact since January. This trendline, now acting as a key support level, will be critical for determining the stock’s next direction. A decisive break and close below $61 could signal bearish momentum and open the door to further selling pressure.
However, this potential downside may be short-lived, as the stock has additional support at the 100-day moving average (100MA), which lies around the $56–$57 range. If the price falls below this zone, a deeper decline is possible, with the next major support located at the 200-day moving average (200MA) near $47–$48.
The current price level may attract buyers looking to capitalise on the stock's proximity to this critical technical support. This could lead to a short-term bounce in Uber’s share price. However, any rebound may be limited due to bearish technical indicators, which suggest selling pressure may persist until the stock stabilises.
For Uber to regain bullish momentum, the stock would need to climb back above $70, a level that could restore investor confidence and signal a potential shift back to a positive trend. Until then, caution is advised.
Key technical indicators currently paint a bearish picture for Uber’s stock:
Uber’s stock remains at a crossroads, with traders monitoring the $61 support level closely. If this level holds, it could provide a foundation for a recovery. However, a break below this point could lead to further downside, testing the $56–$57 range and potentially the $47–$48 zone.
For investors, the technical picture suggests a cautious approach until the stock either stabilises or breaks above key resistance levels like $70, which would signal a return to bullish momentum.

Tradable assets:
Min.Deposit:
Max Leverage:
FCA:

Rating:


 Earnings Calendar
  Economic Calendar
  VAT Calculator
  Tax Free Childcare Calculator
 Percentage Calculator
 Compound Interest Calculator
  Loan Overpayment Calculator
 Mortgage Calculator
 Credit Card Calculator
 Investing
  Economics
 Trading
  Technical Analysis
  Personal Finance
 Calculator


