General Dynamics (GD) Fundamental and Technical Stock Analysis: Can the Defence Prime Keep Outperforming?
$364.70
04 Mar 2026, 12:54
Neutral

Join Minipip Academy and access free courses in investing, trading, economics, and more.
Sign Up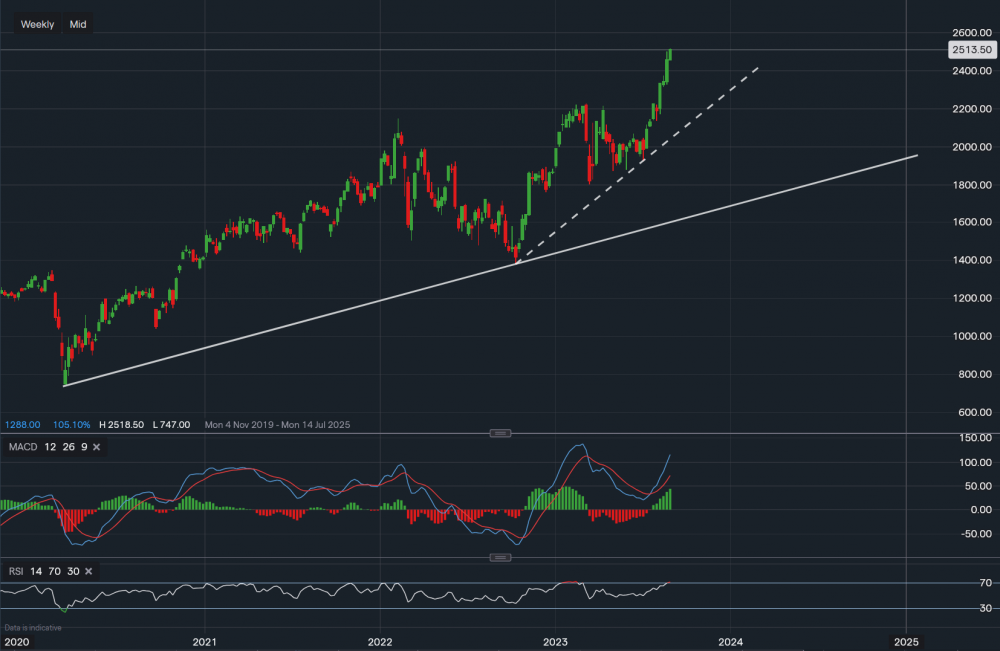
Chart & Data from IG
UBS is due to report earnings tomorrow, currently, its stock is trading at around $25.13 a share. We can see the sharp rise the bank has had since May earlier in the year, perhaps finding more stability due to the optimism within the markets. The next level of resistance sits at $25.72, a break above it could see a push towards $27-$28 in the shorter term. In the longer term, resistance sits at between $31-$32, so if we saw a successful move above $27-$28 then $31-$32 would be on the cards. For the time being, support is well established below. The first line of support sits along the dotted trendline, reading $22.27. A break below it would then force us to look at $18.77 and $17.99 (along the lower trendline). The technical indicators are both positive suggesting that the stock remains in strong bullish momentum, however, the RSI is suggesting that it is now slightly oversold as it reads 71. Therefore, we may see some profit-taking in the short term before any pushes higher.

Tradable assets:
Min.Deposit:
Max Leverage:
FCA:

Rating:


 Earnings Calendar
  Economic Calendar
  VAT Calculator
  Tax Free Childcare Calculator
 Percentage Calculator
 Compound Interest Calculator
  Loan Overpayment Calculator
 Mortgage Calculator
 Credit Card Calculator
 Investing
  Economics
 Trading
  Technical Analysis
  Personal Finance
 Calculator


