General Dynamics (GD) Fundamental and Technical Stock Analysis: Can the Defence Prime Keep Outperforming?
$364.70
04 Mar 2026, 12:54
Neutral

Join Minipip Academy and access free courses in investing, trading, economics, and more.
Sign Up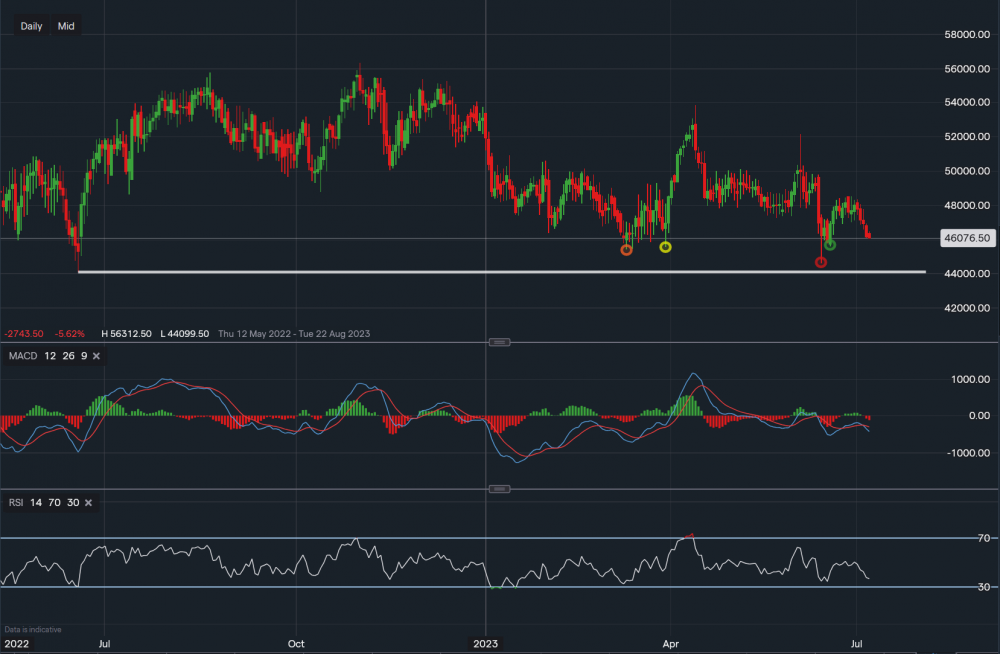
Chart & Data from IG
Looking at UnitedHealth Group as the healthcare and insurance giant is due to report earnings this week (Thursday 13th). Currently, its shares are trading at around $460.76 a share. From a technical perspective, on the daily timeframe, we can see that the price is continuing its longer-term bearish trend. It is now approaching the support level of $456.09 (green oval), a break and close below this support level could see a fall lower towards levels sitting at $455.57 (yellow oval) then at $454.29 (orange) and then at $445.96 (red). The support base sits at $440.99 (white trendline). As the company is reporting earnings, a positive report may see some consolidation and potentially a set-up for a move higher. Therefore, current resistance levels sit at $468.77 then at $470.72 and then at $472.14. A break and close above $472.14 could see the price climb higher towards $478-$480. However, for the time being, the bias remains bearish (negative). Looking at the technical indicators, MACD turned negative once again a couple of days ago and the RSI remains negative as it reads 38. UnitedHealth Group is expected to report an EPS of $6.06 on revenue of $90.94. Announcements of earnings tend to have an influence on the price of stocks, all dependable on the outcome and outlook.

Tradable assets:
Min.Deposit:
Max Leverage:
FCA:

Rating:


 Earnings Calendar
  Economic Calendar
  VAT Calculator
  Tax Free Childcare Calculator
 Percentage Calculator
 Compound Interest Calculator
  Loan Overpayment Calculator
 Mortgage Calculator
 Credit Card Calculator
 Investing
  Economics
 Trading
  Technical Analysis
  Personal Finance
 Calculator


